Houselungo 21 November 21
A lungo length look at this week's housing market news

Home mover high
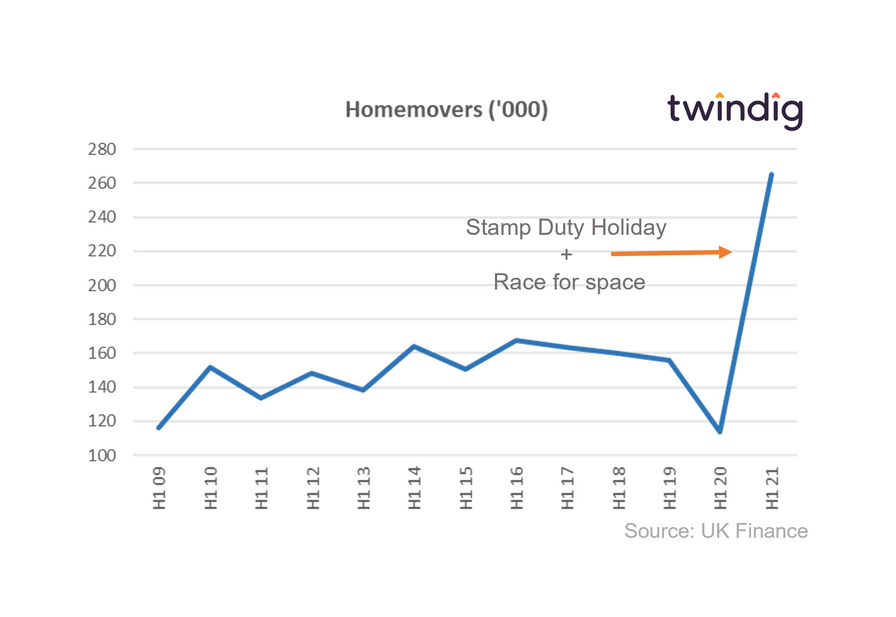
Data released by the Halifax this week shows that the number of home movers more than doubled in the first half of 2021 compared to the same period last year. The total number of moves was 265,070 up 132% from 114,030 in the first half of 2020 as the race for space gathered pace and the sun shone on the stamp duty holiday.
However, the increase in home movers (homeowners moving home) was not down purely to a low level of activity in the first half of 2020, the number of moves is the highest it has been for more than ten years. On an annualised basis the number of home movers is higher than it has been since 2007. The housing market in the first half of 2021 was hotter than it has been since before the credit crunch of 2007.
Home mover highs in numbers
We think the graph below very neatly summarises just how active the housing market has been during the first half of 2021 as the race for space gathered pace and the sun shone on the stamp duty holiday.
June 2021 coincided with the first stamp duty deadline, the stamp duty threshold was reduced from £500,000 on 30 June 2021 to £250,000 on 1 July 2021 which led to a very hectic housing market in June.
UK House prices: Rising everywhere apart from London...
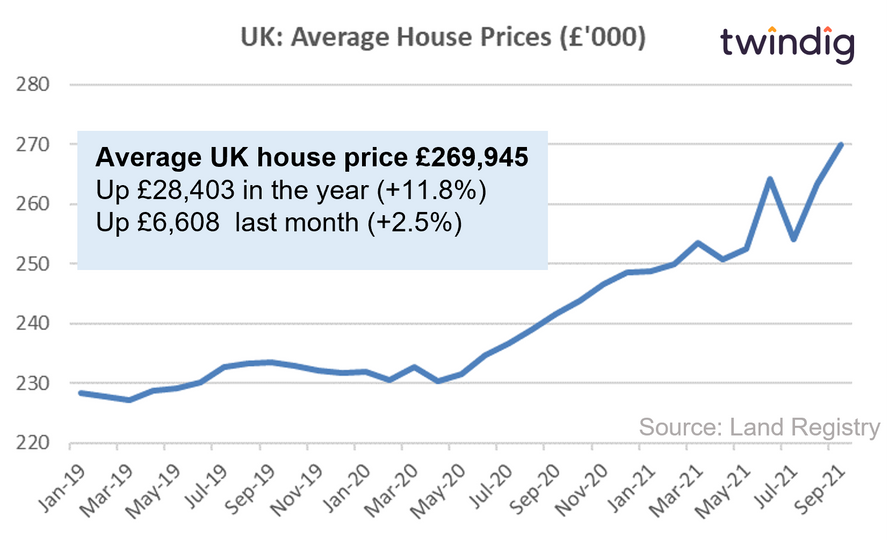
The average house price in the UK is £269,945, average prices have increased by 11.8% or (£28,403) over the last year, and increased by 2.5% or (£6,608) last month. We note that these figures are provisional and subject to change, however, the size and the scale of this bounce back after the fall in July is surprising and perhaps reflects a second push by homeowners to complete transactions before the end of the Stamp Duty Holiday.
UK average house prices have increased by 17.1% (£35,200) since the start of the COVID-19 pandemic.
UK average house prices rise in September
UK house prices rose across all regions apart from London in September 2021, rising on average by £6,608 as homebuyers continued to race to beat the second stamp duty holiday deadline on 30 September 2021.
We did not expect such a large increase in house price in September, as very few housing transactions started in September would have completed by the end of the month, which suggests that homebuyers remain confident about the strength of the housing market after the stamp duty holiday comes to an end. We continue to believe that in the medium-term demand will outstrip underpinning house prices.
House prices fall in London... is the house price tide turning?

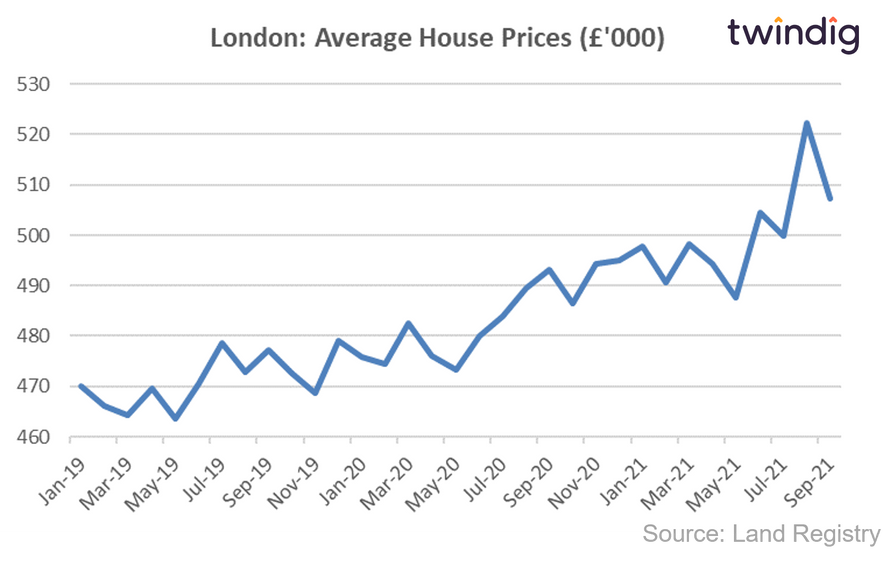
The latest data from the Land Registry shows that the average house price in London fell by 2.9% or £15,112 to £507,253 in September 2021. House prices fell in 13 of the 34 London boroughs during September.
The biggest London house price falls last month were to be found in the City of Westminster down £50,959 (5.0%), Tower Hamlets down £25,724 (5.5%) and Camden down £25,623 (2.8%)
The biggest rises were Lambeth up £34,968 (6.9%), Harrow up £22,010 (4.5%) and Kingston Upon Thames up £16,780 (3.2%)
House Prices in London
The average house price in London is £507,253. This is 76% or £219,358 higher than the £287,895 average house price in England.
House prices in London have risen by 2.8% over the last twelve months compared to an average increase in house prices across England of 11.5%.
In absolute monetary terms, this translates to an average increase of £14,048 in London and £29,740 in England. House prices in England have therefore increased more in relative, but less in absolute terms than they have in London over the last 12 months.
To see the house prices and house price trends by London borough keep reading, you will find all that house price data in the body of this article.
London House Price Outlook
In the short term, following the hiatus of the step change in the stamp duty holiday threshold, we expect house prices in London to increase. The strength of the increase in house prices in August this year was a surprise to us, but we live in an interesting and unusual time. Although the Stamp Duty Holiday benefit has been reduced it is still of some benefit until the end of September. We expect a truer pattern of London house prices to emerge once we see the house price data following the period of the stamp duty holiday.
In the medium term as the pandemic, risks subside and the UK economy is re-opened we would expect to see a continued recovery in housing transaction volumes and positive momentum maintained for house prices.
Please note that lower than usual levels of housing transactions mean that house prices at the borough level will show higher levels of volatility than normal.
Rents follow house prices as tick follows tock…

Property portal Zoopla reported this week that rents are growing at their highest level for 13 years, unlucky for tenants, but lucky for landlords. UK rents are rising at around 5% per annum as demand in major cities doubles.
Why are rents rising so fast?
Zooming back to real life
Zoopla’s research suggests that rents are rising as we return to more normal patterns of life following the end of lockdown restrictions. The resumption of ‘normal’ urban life as we return to our offices, gyms and favourite restaurants and bars as we leave zoom calls behind to meet in person rather than online.
Supply shortages
Zoopla also points out that the supply of properties for rent is also low, some 43% below the five-year average. Structural changes to the rental market such as the additional stamp duty on buy to let properties, changes in taxation relating to property income and expenditure, and an increasing regulatory burden on landlords has taken out capacity from the market. These structural trends are likely to continue, in our view.
Race for space
Much has been made of the race for space in the owner-occupied sector, where lockdown experiences coupled with the opportunities provided by the stamp duty holiday led homebuyers to seek bigger homes with more internal (that home office) and external (a garden) space.
The same race for space has also happened in the rental market coupled with households seeking to rent in a less rural environment to try out the ‘good-life’ before committing to a home purchase.
Equity release leaps 19% in Q3 2021

As lockdown restrictions eased and the opportunities to spend returned in force, the volume of and value of equity release mortgages arranged in Q3 2021 leapt as old homeowners found a fresh spring in their step.
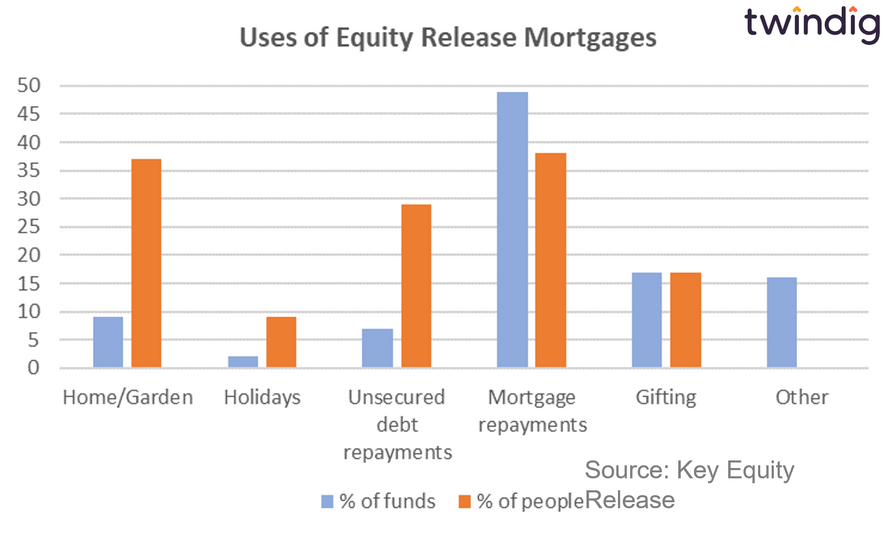
Uses of equity release mortgages
Interestingly the biggest ‘use’ of equity release mortgages (both in value and volume terms) is the repayment of mortgages. More than half (56%) of all equity release mortgages were used to repay debt, either mortgage debt or unsecured debt. However much of this re-mortgaging was undertaken to take advantage of lower mortgage rates.
Twindig Housing Market Index
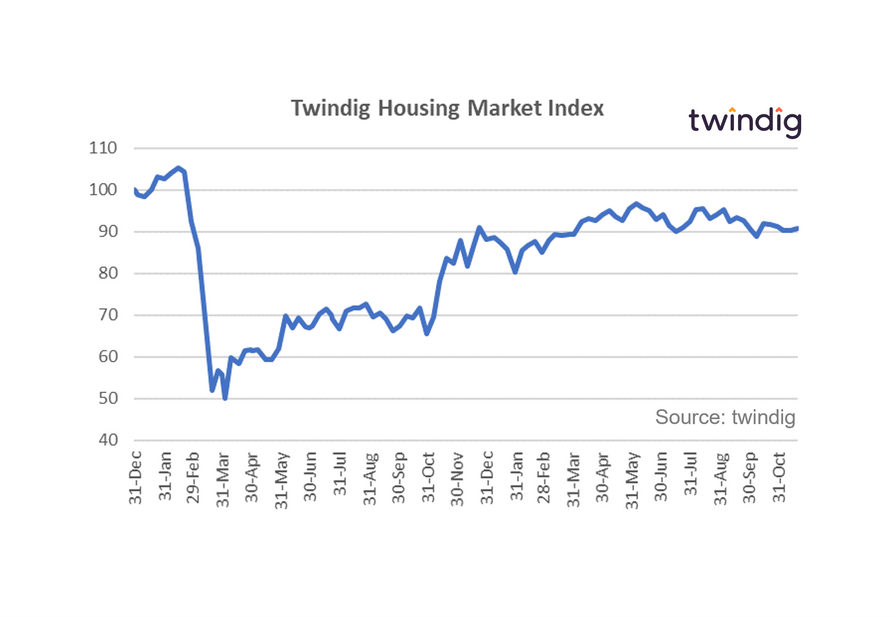
In what was another quiet week for the UK housing market, the Twindig Housing Market Index increased by 0.4% this week to 90.8. This was the week that saw equity release loans leap by 19% in Q3 2021 as lockdown restrictions continued to ease and the number of ways to spend your money increased.
House prices, as reported by the Land Registry continued to rise although house prices in London faltered. It is too early to tell yet if this is London setting the scene for future trends as the impact of the stamp duty holiday starts to unwind or just a case of post (stamp duty) holiday blues. Fortunately for homeowners, our investor confidence measures suggest a case of the blues rather than a turning of the house price tide.