Home Mover High

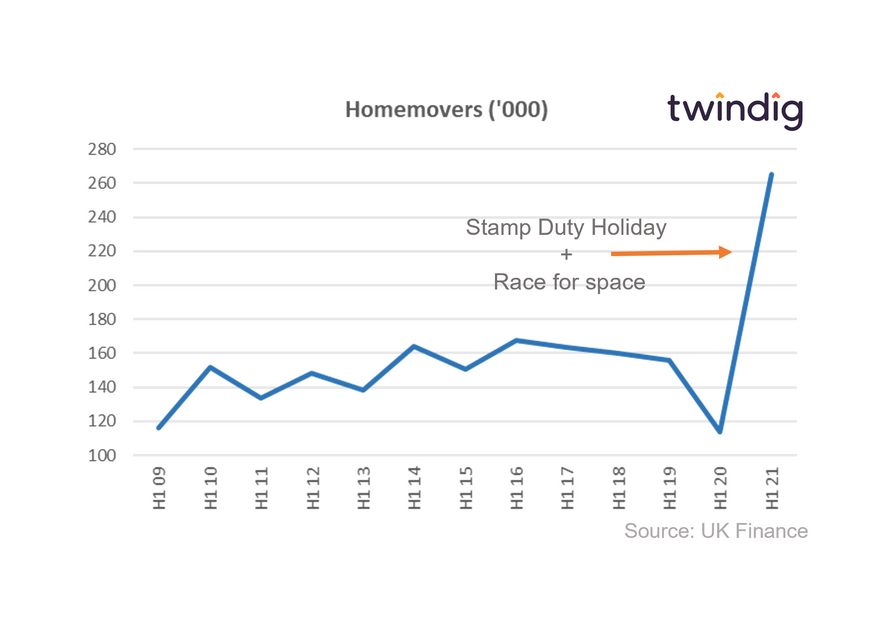
Data released by the Halifax this morning shows that the number of home movers more than doubled in the first half of 2021 compared to the same period last year. The total number of moves was 265,070 up 132% from 114,030 in the first half of 2020 as the race for space gathered pace and the sun shone on the stamp duty holiday.
However, the increase in home movers (homeowners moving home) was not down purely to a low level of activity in the first half of 2020, the number of moves is the highest it has been for more than ten years. On an annualised basis the number of home movers is higher than it has been since 2007. The housing market in the first half of 2021 was hotter than it has been since before the credit crunch of 2007.
Home mover highs in numbers
We think the graph below very neatly summarises just how active the housing market has been during the first half of 2021 as the race for space gathered pace and the sun shone on the stamp duty holiday.
June 2021 coincided with the first stamp duty deadline, the stamp duty threshold was reduced from £500,000 on 30 June 2021 to £250,000 on 1 July 2021 which led to a very hectic housing market in June.
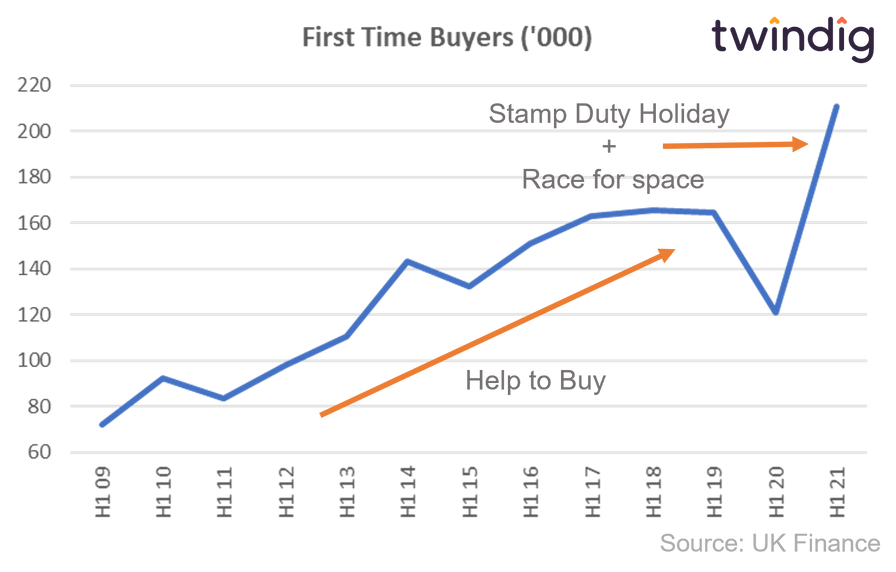
The number of first-time buyer housing transactions also increased in the first half of 2021, but not by as much as for home movers. However, since 2013 first time buyers have been assisted by Help to Buy (when buying new build homes) and the impact of the stamp duty holiday was therefore not as great for first-time buyers who are more likely to be constrained by lending multiples and deposits, rather than stamp duty costs.
The race for space
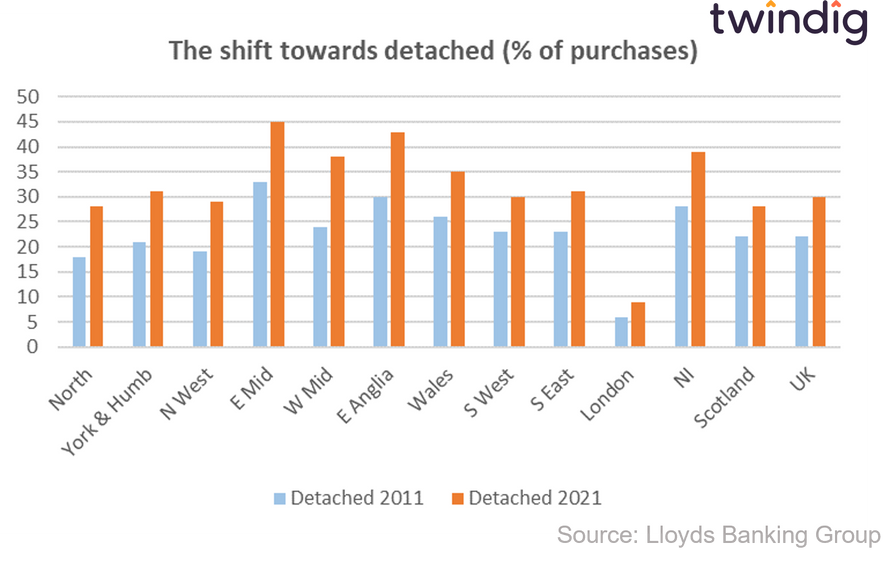
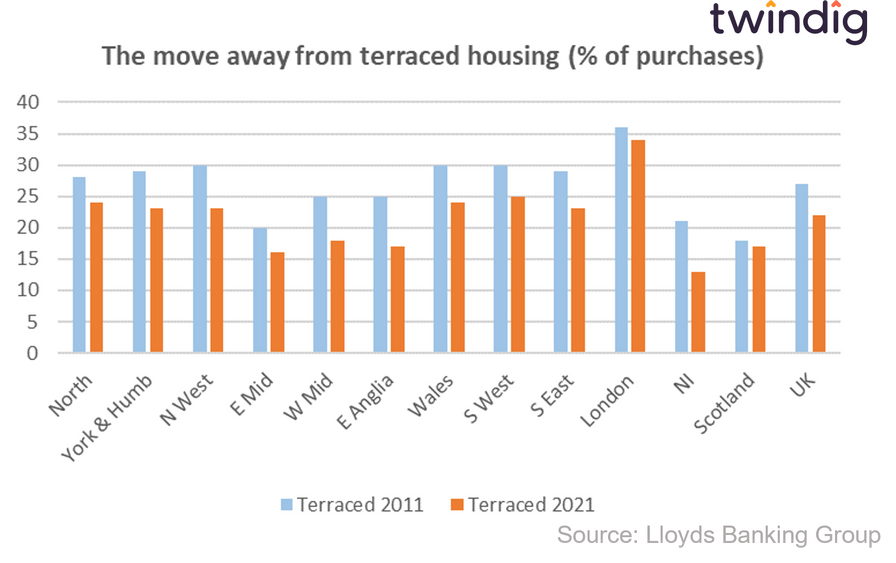
The Halifax Homemover report compares the type of property purchased in the year to 30 September 2021 to the year to 30 September 2011 and this clearly demonstrates the race for space. We highlight in the two graphs below the shift towards detached homes and the move away from terraced housing.
If so many homes are being sold, how can there be a stock shortage?
With any estate agent worth their salt being short of stock to sell, one might wonder how so many homes have been sold over the last year.
It is true that the average number of homes per branch for sale are low, as illustrated by the RICS Data below:
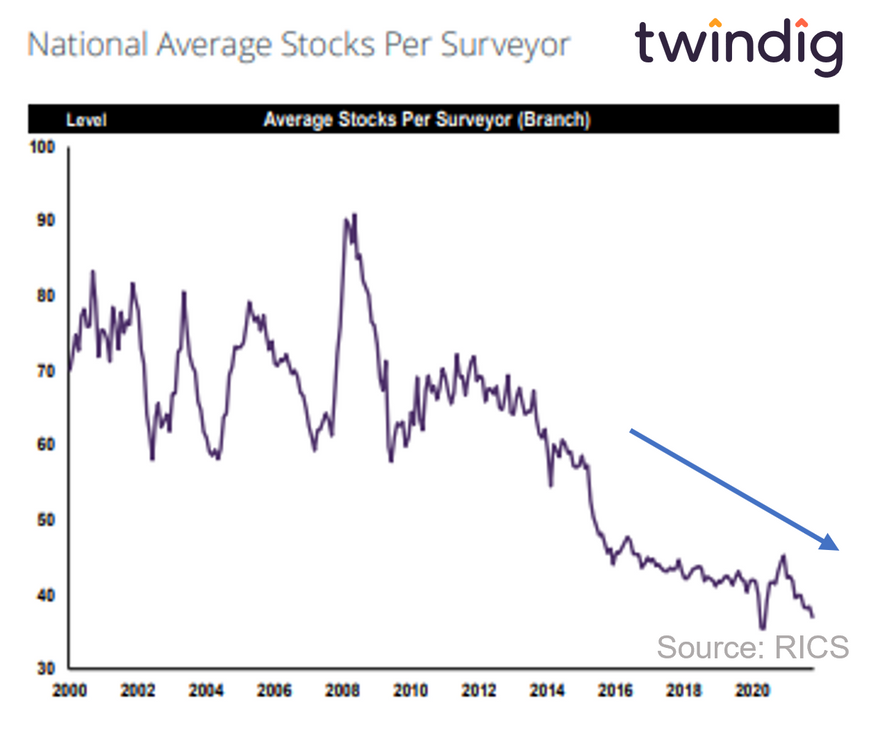
However, the low stock levels are due to the high turnover of that stock as illustrated by the high ratio of sales to stock available to sell. Homes are selling like hot cakes
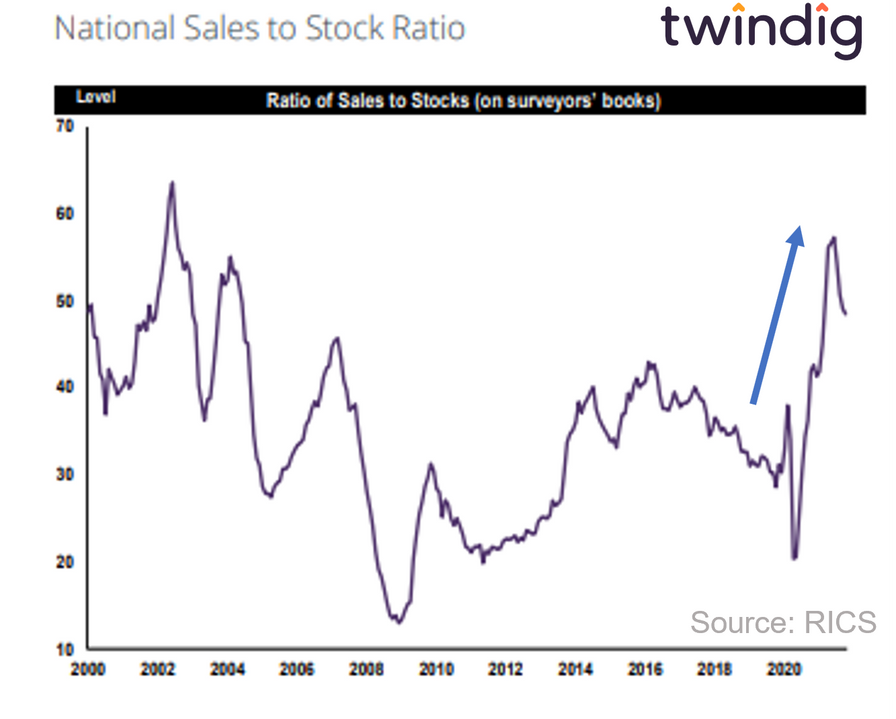
Estate agents are therefore short of stock because the homes that are for sale are selling so quickly.