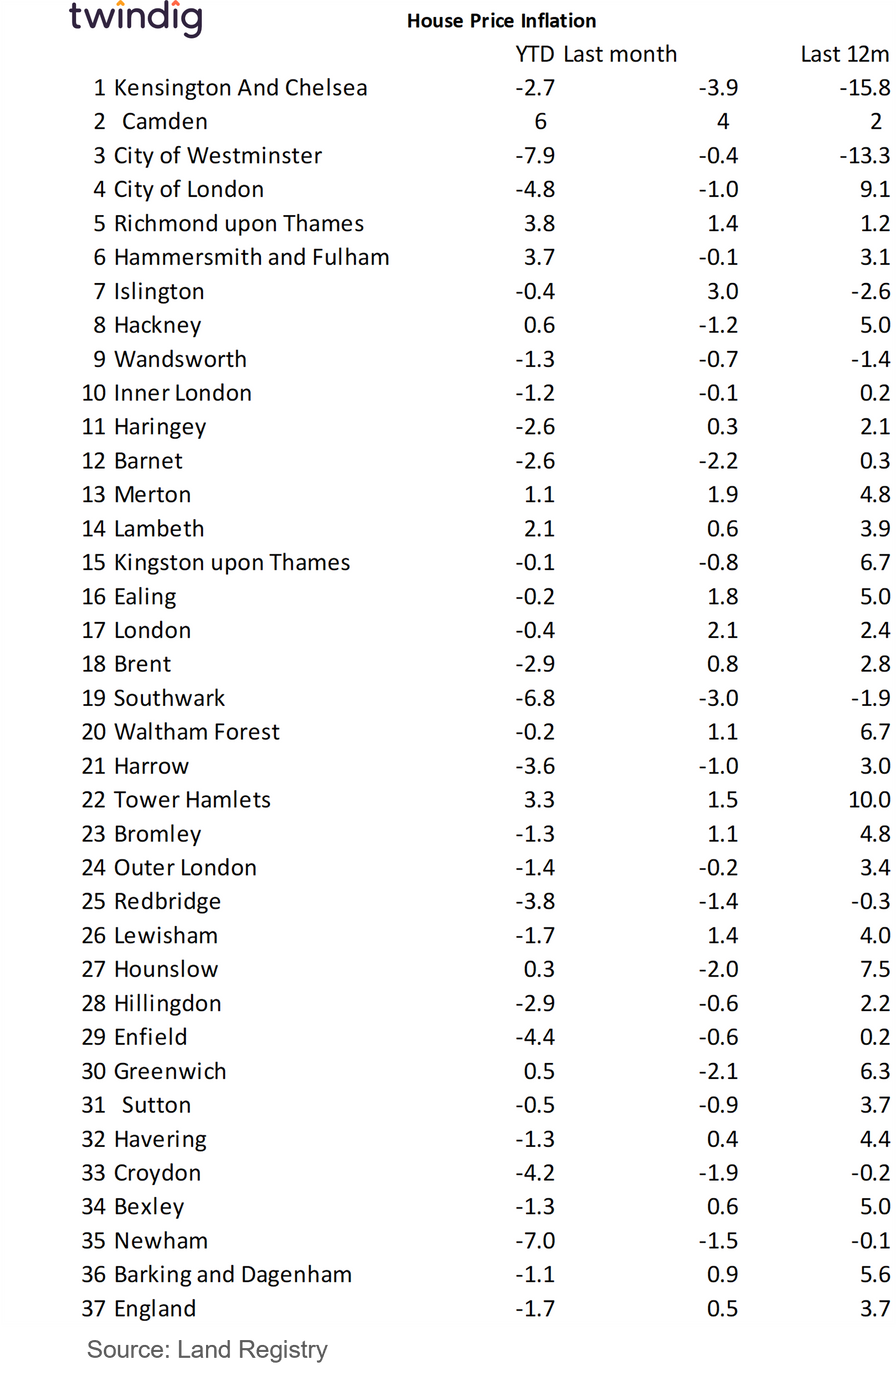
London House Prices by London borough
The latest data from the Land Registry shows that the average house price in London rose by 2.1% or £10,956 to £533,687 in April 2023 as house prices rose in 16 of the 34 London boroughs during the month.
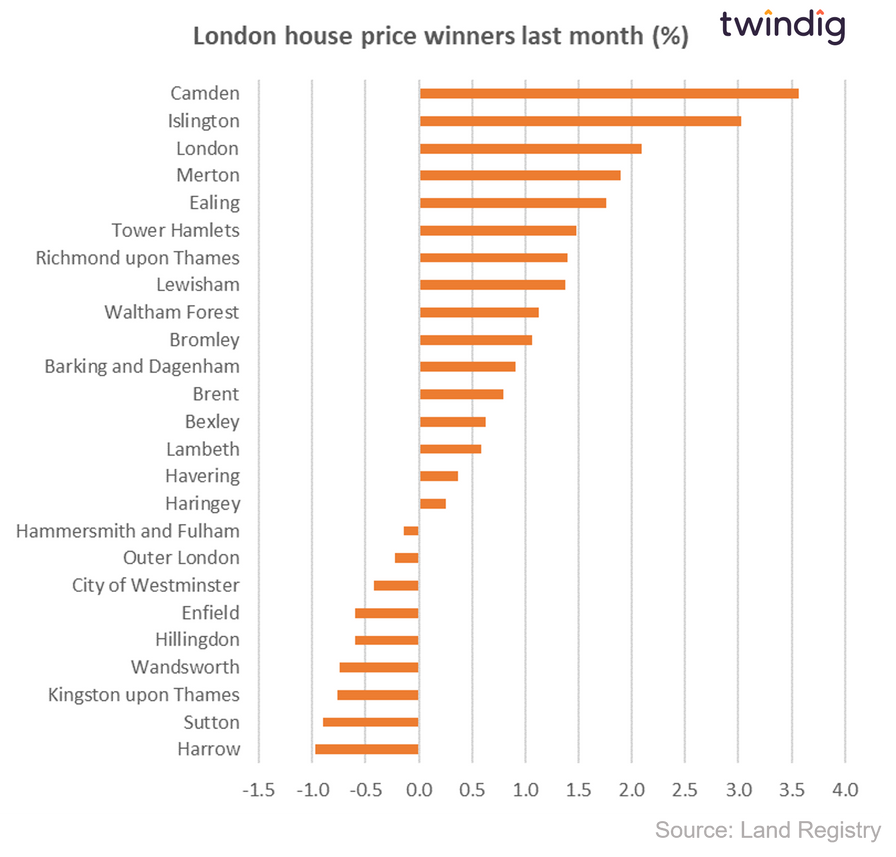
The biggest London house price rises last month were to be found in the Camden where house prices rose by £30,836 (3.6%), followed by the London borough of Islington up £20,620 (3.0%) and the London borough of Merton up £10,956 (1.9%).
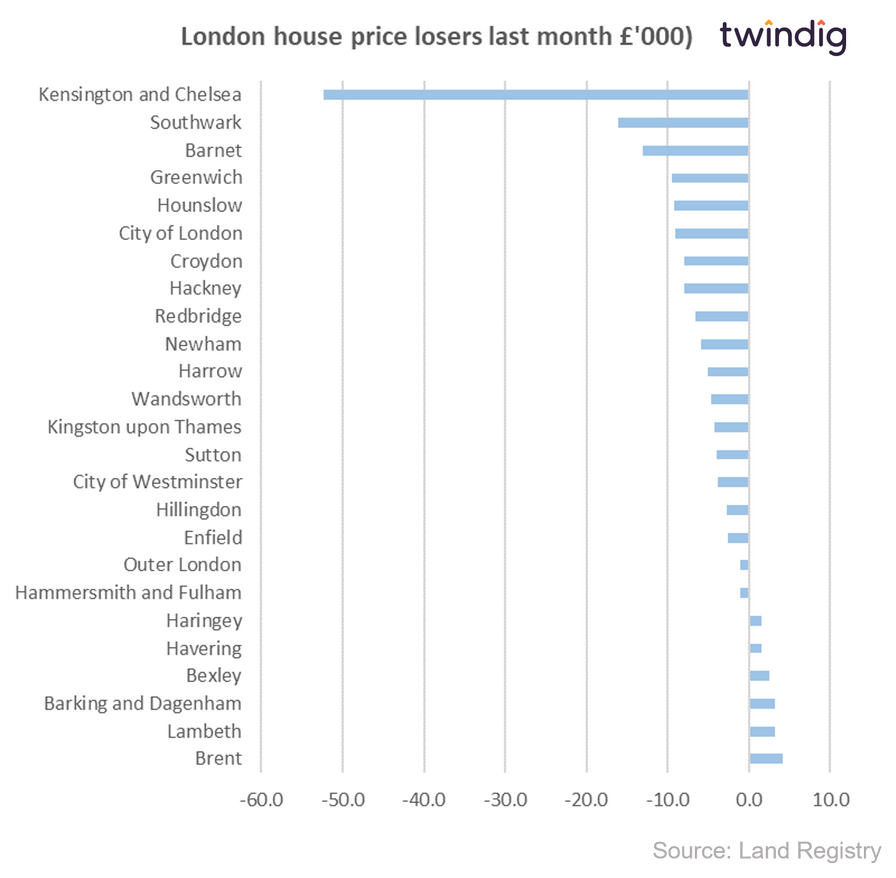
However, not all boroughs saw average house prices rise, the biggest house price falls were seen in Kensington and Chelsea down £52,368 (3.9%), Southwark down £16,075 (3.0%), and Barnet down £13,026 (2.2%).
House Prices in London
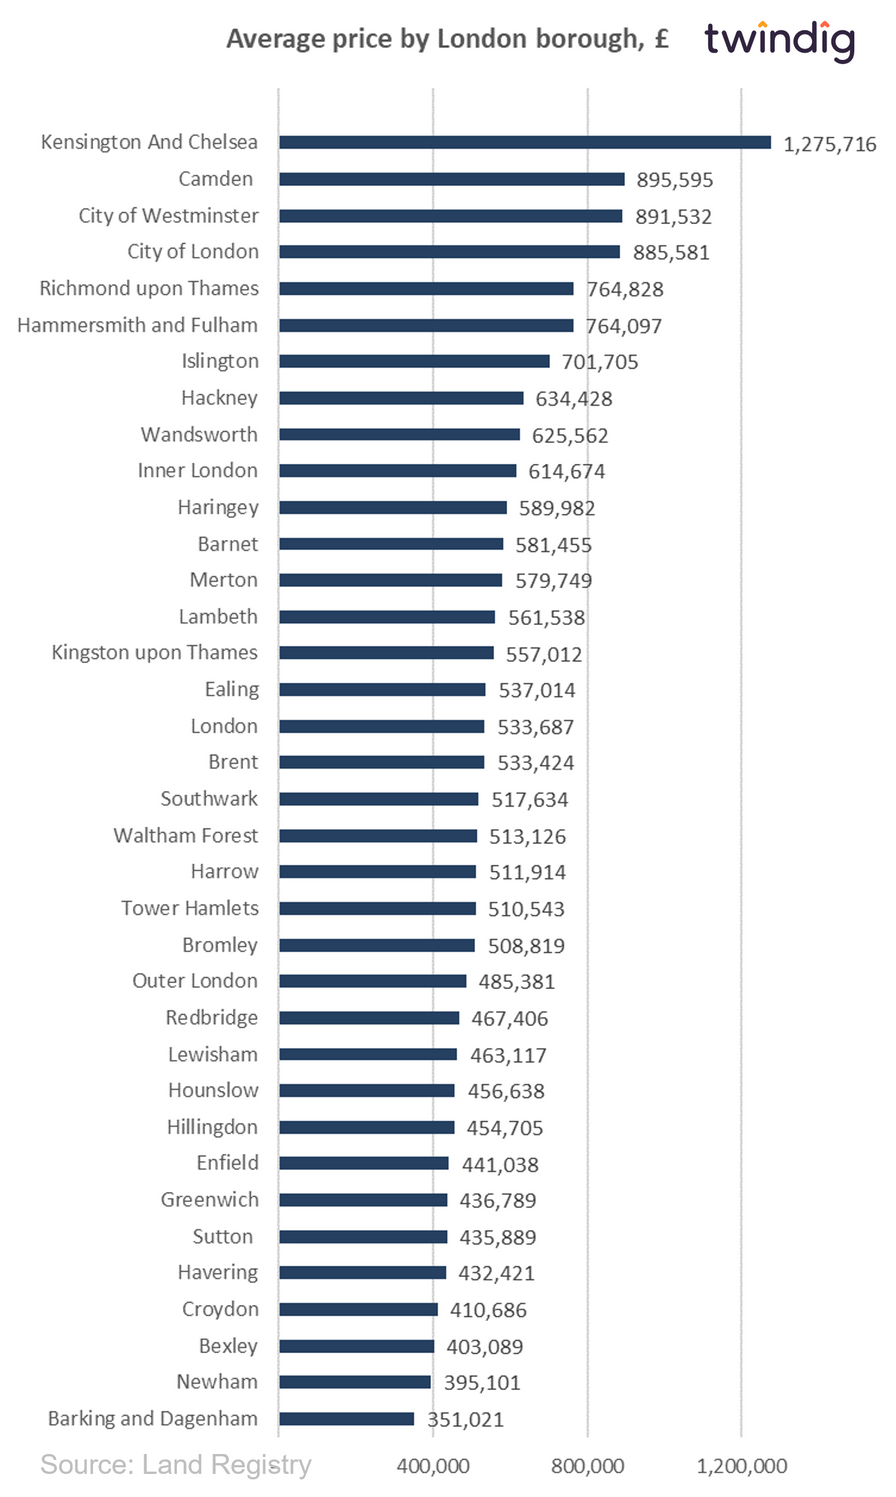
The average house price in London is £533,687. This is 75% or £227,956 higher than the £305,731 average house price in England.
House prices in London have risen by 2.4% over the last twelve months compared to an average increase in house prices across England of 3.7%.
In absolute monetary terms, this translates to an average increase of £12,374 in London and £10,976 in England. House prices in England have therefore increased more in relative, but less in absolute terms than they have in London over the last 12 months.
To see the house prices and house price trends by London borough keep reading, you will find all that house price data in the body of this article.
London House Price Outlook
After a very hectic couple of years in the London housing market, normality returned to the London housing market in 2022 and it seems that 2023 will see lower levels of activity than 2022 accompanied by modest falls in house prices, although a shortage of homes for sale is keeping prices keen.
Whilst house prices in London rose in April house prices across the capital are finely balanced with 16 London boroughs seeing house price rises and 18 house price falls. We expect that house prices will soften in the coming months in London, but we do not expect to see a house price crash.
In the medium term, the war on inflation is the biggest risk factor for London house prices, but as inflation is taken back under control we would expect to see a continued recovery in housing transaction volumes and positive momentum maintained for house prices.
Please note that lower-than-usual levels of housing transactions mean that house prices at the borough level will show higher levels of volatility than normal.
Claim your free digital property logbook and keep up to date with the house prices on your street
London House Price Graphs
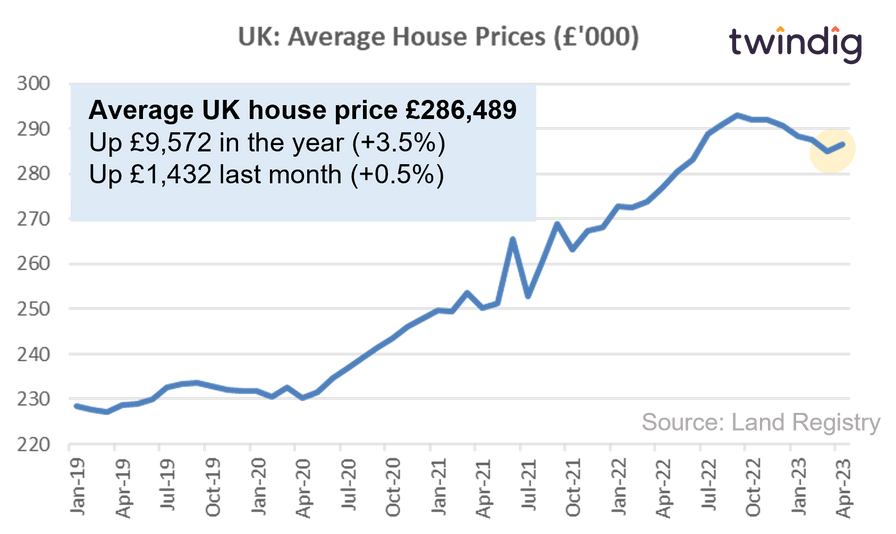
House Price Graph 1: Average London House Prices Since January 2019
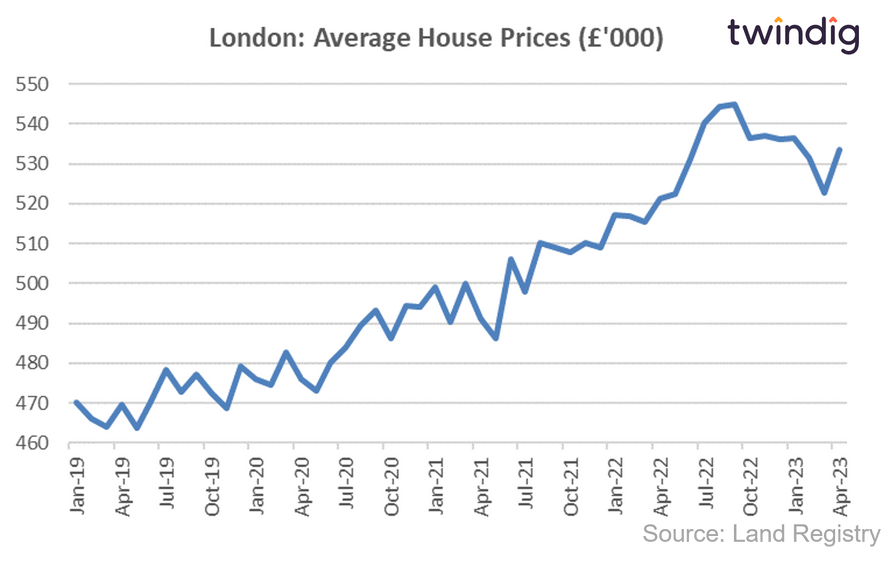
House prices in London rose by 2.1% or £10,956 last month, whereas house prices rose by 0.5% or £1,557 across England.
House Price Graph 2: Average London House Prices by London Borough
London House price Winners last month
We show in the chart below London's house price winners over the last month in percentage terms across the top 25 London boroughs
We show in the chart below the biggest absolute gains in house prices (house price increases in monetary value) across the top-performing 25 London boroughs
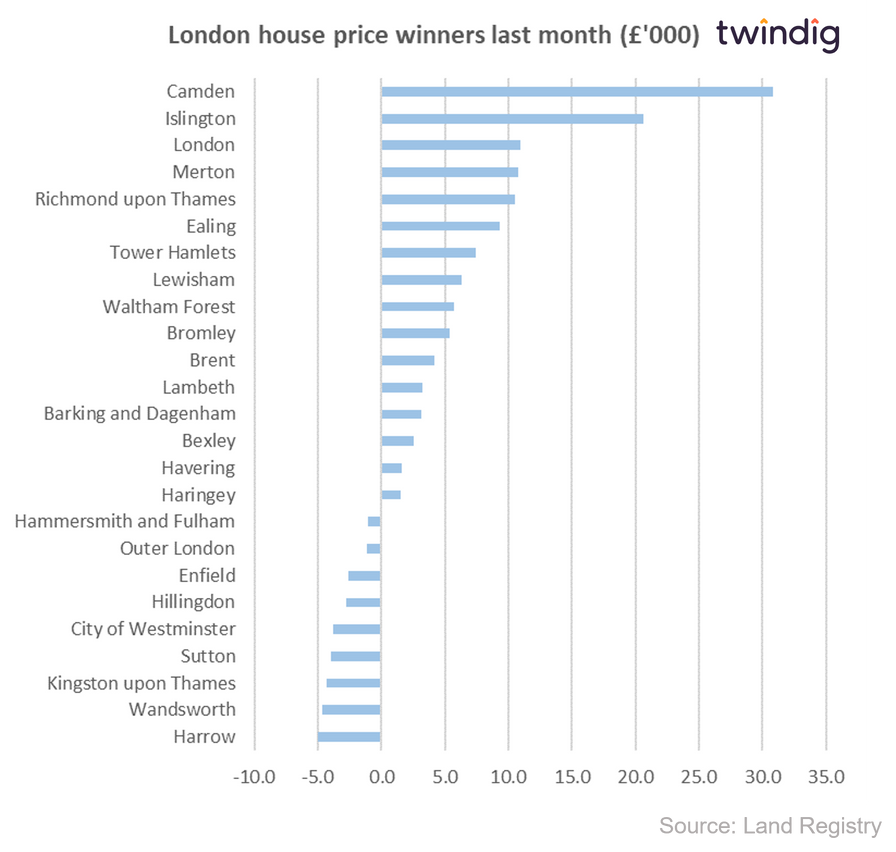
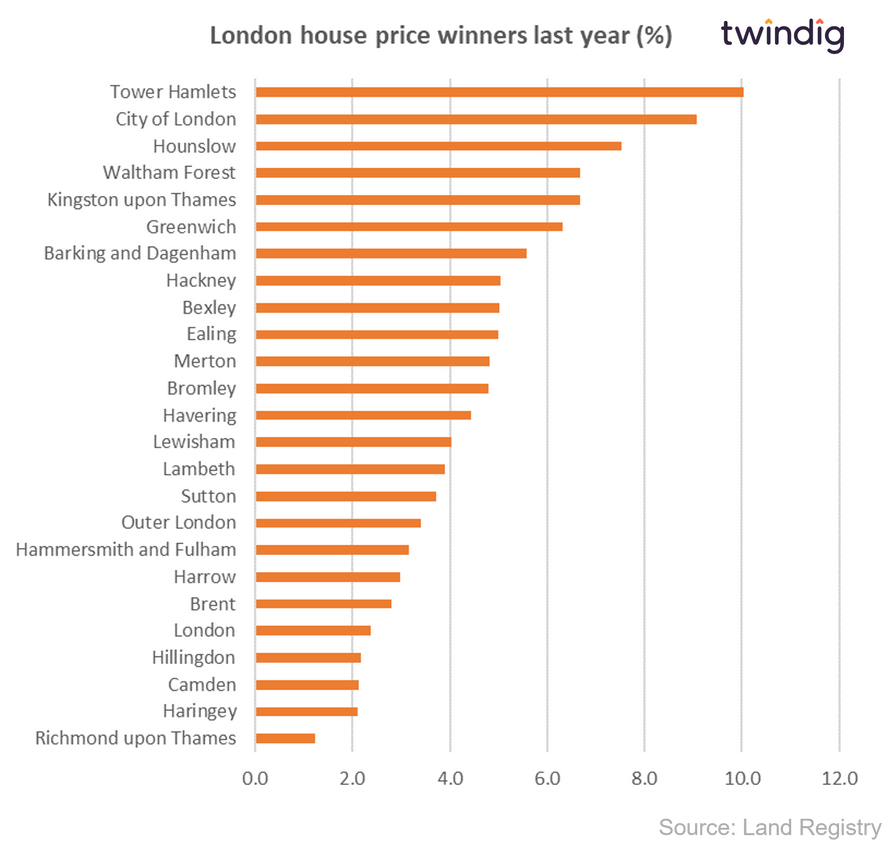
London House price Winners last year
We show in the chart below the top 25 London boroughs by house price gains in percentage terms over the last year
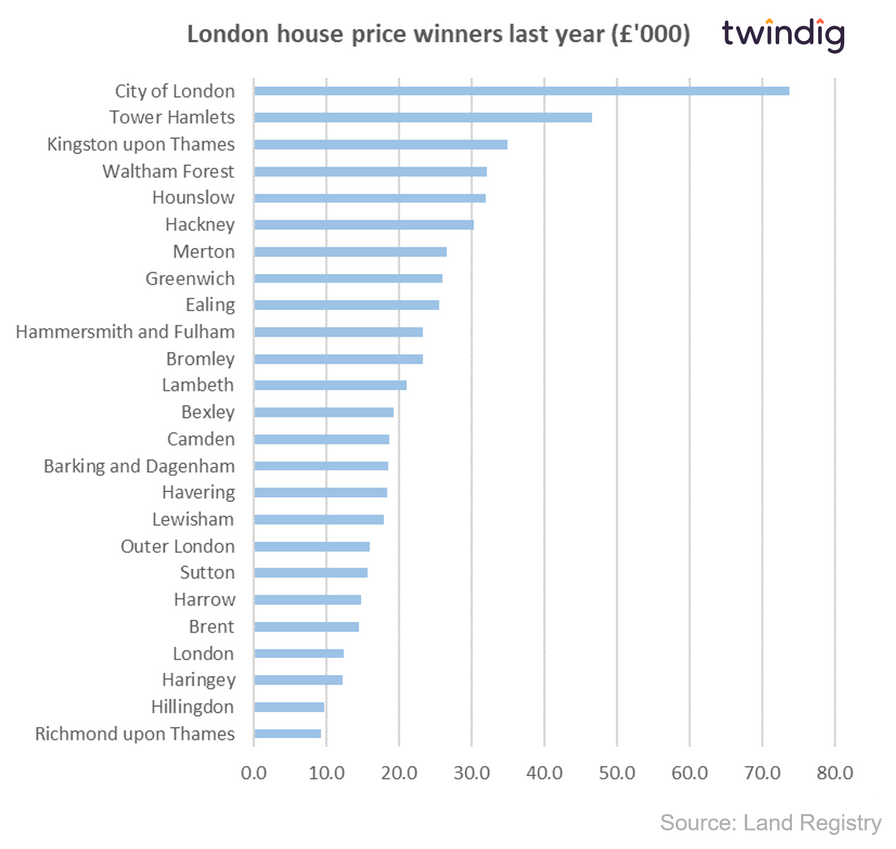
We show in the chart below the top 25 London boroughs by house price gains in monetary terms over the last year
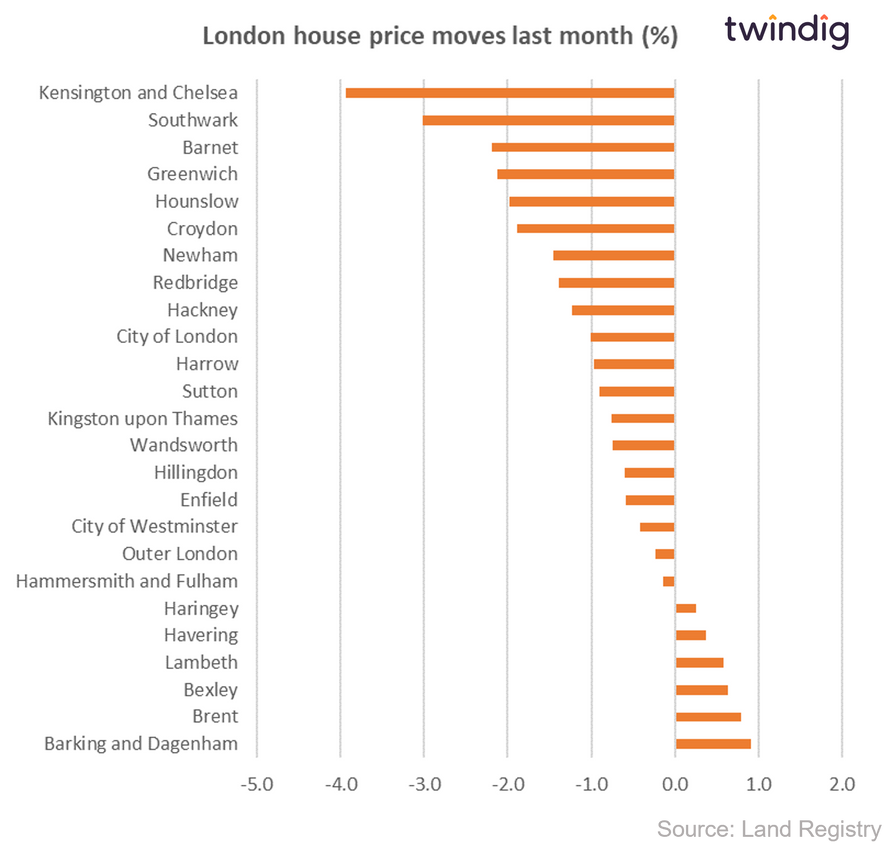
London House Price Losers Last Month
We show in the chart below London's house price losers over the last month in percentage terms
We show in the chart below London's house price losers in monetary terms over the last month
London House Price Losers Last 12 months
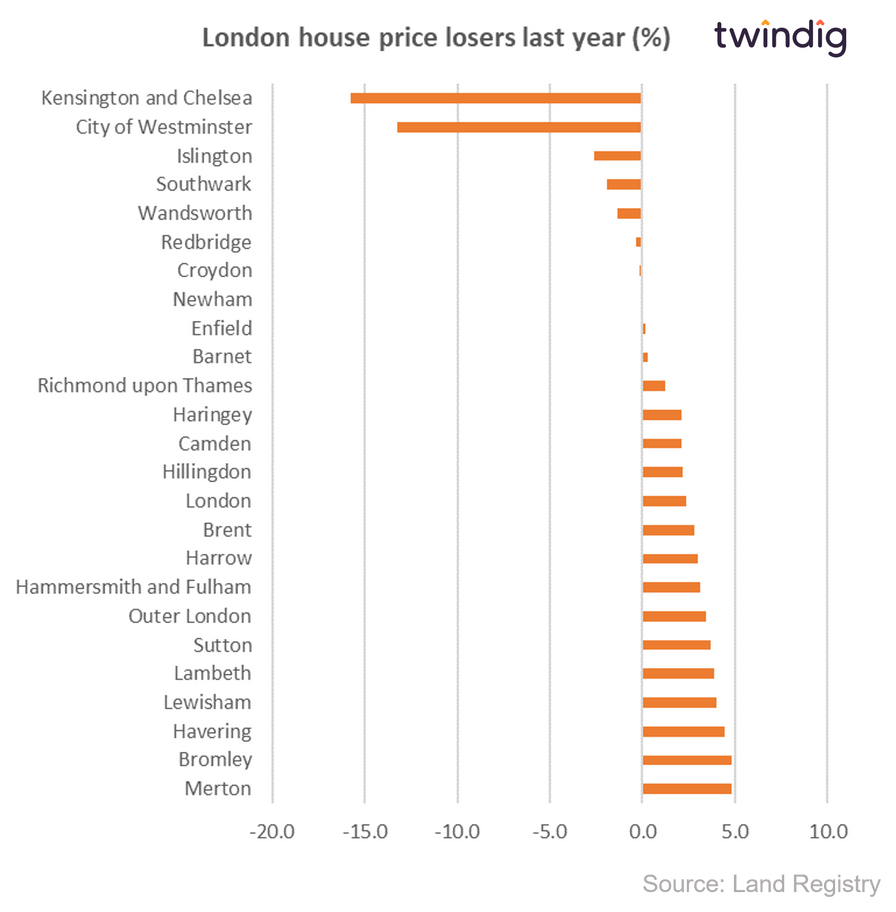
We show in the chart below London's house price losers over the last 12 months (one year) in percentage terms
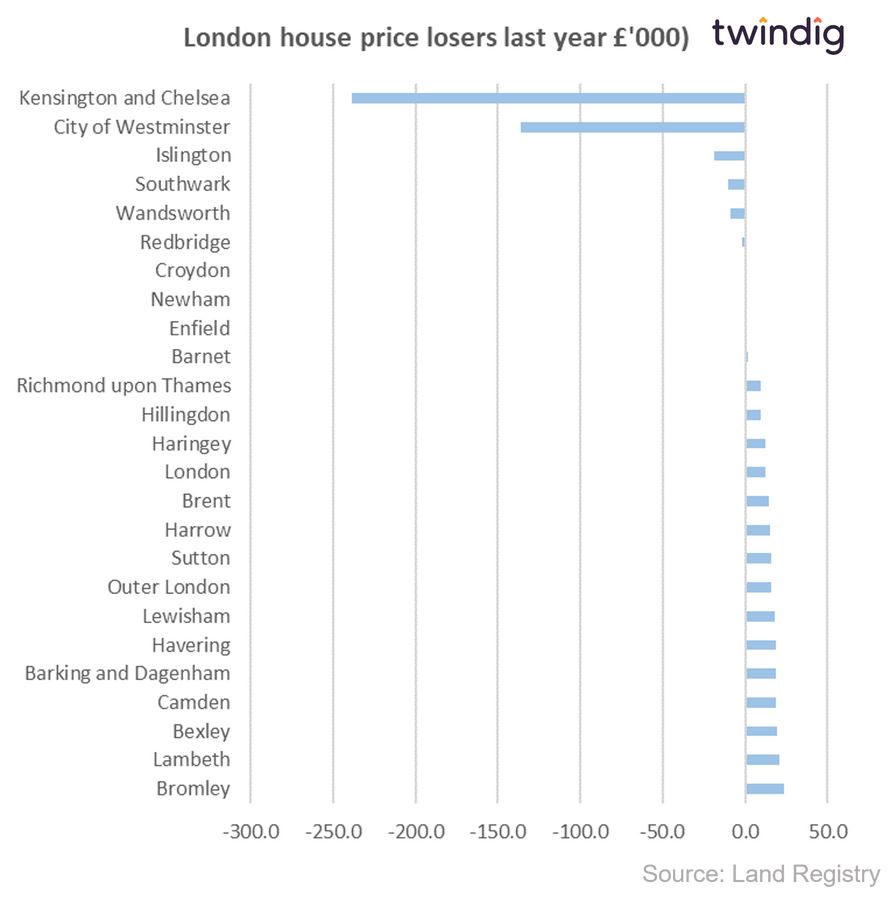
We show in the chart below London's house price losers over the last 12 months (one year) in monetary terms
London House Price Lockdown Winners and Losers
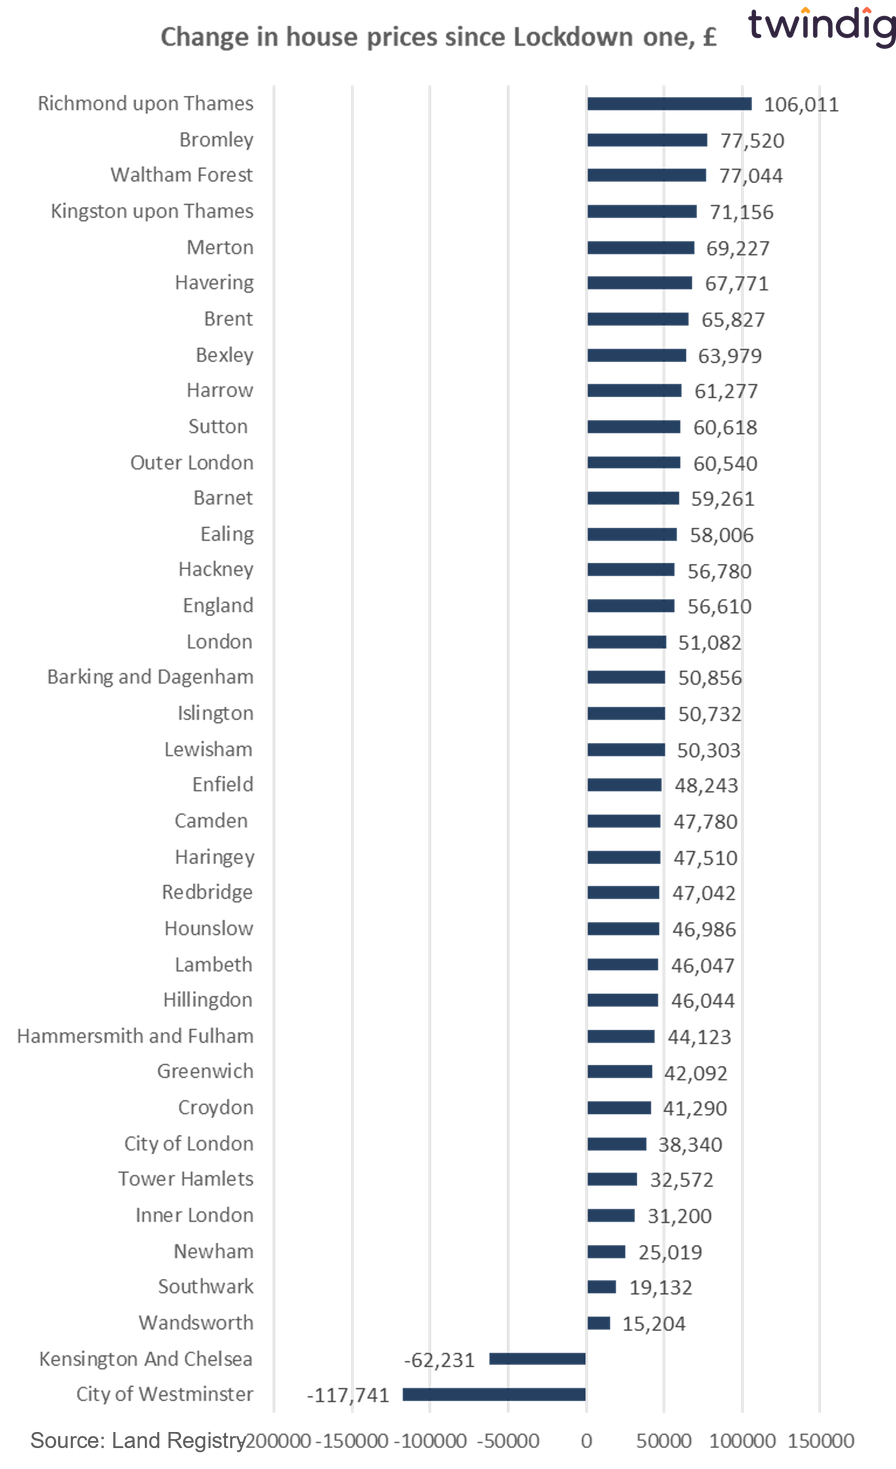
We show in the chart below the change in London house prices since the first lockdown in March 2020, we believe this to be a good proxy for the impact of the COVID-19 pandemic on the London housing market.
The biggest lockdown house price winners
In first place is Richmond upon Thames, where average house prices are up £106,011 (16.1%)
Bromley is in second place where house prices are up £77,520 (18.0%), and
the London borough of Waltham Forest is in third place where house prices are up £77,044 (17.7%)
On average house prices in London have increased by £51,082 or by 10.6% since the start of the first lockdown, whereas across England average house prices have increased by £56,610 or 22.7%
The biggest lockdown house price losers
At the other end of the scale the London boroughs which have performed the worst since the start of the first lockdown are:
The City of Westminster, where house prices have fallen by £117,741 or 11.7% since the start of the first lockdown.
House prices in Kensington and Chelsea have fallen by £62,231 (4.7%), and
Wandsworth where house prices have risen by £15,204 (2.5%) since the start of the first lockdown.
We show the house price changes since lockdown for each London borough below:
How much is my house worth?
If you would like to quickly see how much your house is worth you can do so by visiting twindig.com we have details of every house across the country, all 28 million, not just the one million or so that are currently for sale or rent
London house prices by borough
In this section, we look at the house price trends for each London borough, borough by borough
House prices in Kensington and Chelsea
The average house price in Kensington and Chelsea is £1,275,716. Kensington and Chelsea has the most expensive average house prices of all the London boroughs.
House prices in Kensington and Chelsea have:
Fallen by 15.8% or £238,594 over the last twelve months
Fallen by 3.9% or £52,638 in the last month
Fallen by 4.7% or £62,231 since the start of Lockdown One
House prices in the City of Westminster
The average house price in the City of Westminster is £891,532.
House prices in the City of Westminster have:
Fallen by 13.3% or £136,432 over the last twelve months
Fallen by 0.4% or £3,766 in the last month
Fallen by 11.7% or £117,741 since the start of Lockdown One
House prices in Camden
The average house price in Camden is £895,595.
House prices in Camden have:
Risen by 2.1% or £18,679 over the last twelve months
Risen by 3.6% or £30,836 in the last month
Risen by 5.6% or £47,780 since the start of Lockdown One
House prices in the City of London
The average house price in the City of London is £885,581
House prices in the City of London have:
Risen by 9.1% or £73,735 over the last twelve months
Fallen by 1.0% or £9,003 in the last month
Risen by 4.5% or £38,340 since the start of Lockdown One
House Prices in Hammersmith and Fulham
The average house price in Hammersmith and Fulham is £764,097.
House prices in Hammersmith and Fulham have:
Risen by 3.1% or £23,329 over the last twelve months
Fallen by 0.1% or £1,099 in the last month
Risen by 6.1% or £44,123 since the start of Lockdown One
House Prices in Islington
The average house price in Islington is £701,705.
House prices in Islington have:
Fallen by 2.6% or £18,769 over the last twelve months
Risen by 3.0% or £20,620 in the last month
Risen by 7.8% or £50,732 since the start of Lockdown One
House Prices in Richmond upon Thames
The average house price in Richmond upon Thames is £764,828
House prices in Richmond have:
Risen by 1.2% or £9,331 over the last twelve months
Risen by 1.4% or £10,549 in the last month
Risen by 16.1% or £106,011 since the start of Lockdown One
House Prices in Wandsworth
The average house price in Wandsworth is £625,562
House prices in Wandsworth have:
Fallen by 1.4% or £8,732 over the last twelve months
Fallen by 0.7% or £4,665 in the last month
Risen by 2.5% or £15,204 since the start of Lockdown One
House Prices in Haringey
The average house price in Haringey is £589,982.
House prices in Haringey have:
Risen by 2.1% or £12,240 over the last twelve months
Risen by 0.3% or £1,495 in the last month
Risen by 8.8% or £47,510 since the start of Lockdown One
House Prices in Hackney
The average house price in Hackney is £634,428.
House prices in Hackney have:
Risen by 5.0% or £30,388 over the last twelve months
Fallen by 1.2% or £7,889 in the last month
Risen by 9.8% or £56,780 since the start of Lockdown One
House Prices in Merton
The average house price in Merton is £579,749.
House prices in Merton have:
Risen by 4.8% or £26,591 over the last twelve months
Risen by 1.9% or £10,752 in the last month
Risen by 13.6% or £69,227 since the start of Lockdown One
House Prices in Lambeth
The average house price in Lambeth is £561,538.
House prices in Lambeth have:
Risen by 3.9% or £21,044 over the last twelve months
Risen by 0.6% or £3,261 in the last month
Risen by 8.9% or £46,047 since the start of Lockdown One
House Prices in Barnet
The average house price in Barnet is £581,455.
House prices in Barnet have:
Risen by 0.3% or £1,762 over the last twelve months
Fallen by 2.2% or £13,026 in the last month
Risen by 11.3% or £59,261 since the start of Lockdown One
House Prices in Kingston upon Thames
The average house price in Kingston upon Thames is £557,012.
House prices in Kingston upon Thames have:
Risen by 6.7% or £34,870 over the last twelve months
Fallen by 0.8% or £4,285 in the last month
Risen by 14.6% or £71,156 since the start of Lockdown One
House Prices in Brent
The average house price in Brent is £533,424.
House prices in Brent have:
Risen by 2.8% or £14,558 over the last twelve months
Risen by 0.8% or £4,195 in the last month
Risen by 14.1% or £65,827 since the start of Lockdown One
House Prices in Ealing
The average house price in Ealing is £537,014.
House prices in Ealing have:
Risen by 5.0% or £25,504 over the last twelve months
Risen by 1.8% or £9,272 in the last month
Risen by 12.1% or £58,006 since the start of Lockdown One
House Prices in Southwark
The average house price in Southwark is £517,634.
House prices in Southwark have:
Fallen by 1.9% or £10,170 over the last twelve months
Fallen by 3.0% or £16,075 in the last month
Risen by 3.8% or £19,132 since the start of Lockdown One
House Prices in Tower Hamlets
The average house price in Tower Hamlets is £510,543.
House prices in Tower Hamlets have:
Risen by 10.0% or £46,600 over the last twelve months
Risen by 1.5% or £7,424 in the last month
Risen by 6.8% or £32,572 since the start of Lockdown One
House Prices in Waltham Forest
The average house price in Waltham Forest is £513,126.
House prices in Waltham Forest have:
Risen by 6.7% or £32,126 over the last twelve months
Risen by 1.1% or £5,718 in the last month
Risen by 17.7% or £77,044 since the start of Lockdown One
House Prices in Harrow
The average house price in Harrow is £511,914.
House prices in Harrow have:
Risen by 3.0% or £14,832 over the last twelve months
Fallen by 1.0% or £5,020 in the last month
Risen by 13.6% or £61,277 since the start of Lockdown One
House Prices in Bromley
The average house price in Bromley is £508,819.
House prices in Bromley have:
Risen by 4.8% or £23,281 over the last twelve months
Risen by 1.1% or £5,351 in the last month
Risen by 18.0% or £77,520 since the start of Lockdown One
House Prices in Lewisham
The average house price in Lewisham is £463,117.
House prices in Lewisham have:
Risen by 4.0% or £17,955 over the last twelve months
Risen by 1.4% or £6,283 in the last month
Risen by 12.2% or £50,303 since the start of Lockdown One
House Prices in Redbridge
The average house price in Redbridge is £467,406.
House prices in Redbridge have:
Fallen by 0.3% or £1,622 over the last twelve months
Fallen by 1.4% or £6,556 in the last month
Risen by 11.2% or £47,042 since the start of Lockdown One
House Prices in Hounslow
The average house price in Hounslow is £456,638.
House prices in Hounslow have:
Risen by 7.5% or £31,922 over the last twelve months
Fallen by 2.0% or £9,235 in the last month
Risen by 11.5% or £46,986 since the start of Lockdown One
House Prices in Hillingdon
The average house price in Hillingdon is £454,705.
House prices in Hillingdon have:
Risen by 2.2% or £9,720 over the last twelve months
Fallen by 0.6% or £2,733 in the last month
Risen by 11.3% or £46,044 since the start of Lockdown One
House Prices in Greenwich
The average house price in Greenwich is £436,789
House prices in Greenwich have:
Risen by 6.3% or £25,942 over the last twelve months
Fallen by 2.1% or £9,453 in the last month
Risen by 10.7% or £42,092 since the start of Lockdown One
House Prices in Enfield
The average house price in Enfield is £441,038.
House prices in Enfield have:
Risen by 0.2% or £782 over the last twelve months
Fallen by 0.6% or £2,633 in the last month
Risen by 12.3% or £48,243 since the start of Lockdown One
House Prices in Croydon
The average house price in Croydon is £410,686.
House prices in Croydon have:
Fallen by 0.2% or £716 over the last twelve months
Fallen by 1.9% or £7,919 in the last month
Risen by 11.2% or £41,290 since the start of Lockdown One
House Prices in Sutton
The average house price in Sutton is £435,889.
House prices in Sutton have:
Risen by 3.7% or £15,624 over the last twelve months
Fallen by 0.9% or £3,967 in the last month
Risen by 16.2% or £60,618 since the start of Lockdown One
House Prices in Newham
The average house price in Newham is £395,101.
House prices in Newham have:
Fallen by 0.1% or £368 over the last twelve months
Fallen by 1.5% or £5,832 in the last month
Risen by 6.8% or £25,019 since the start of Lockdown One
House Prices in Havering
The average house price in Havering is £432,421.
House prices in Havering have:
Risen by 4.4% or £18,350 over the last twelve months
Risen by 0.4% or £1,609 in the last month
Risen by 18.6% or £67,771 since the start of Lockdown One
House Prices in Bexley
The average house price in Bexley is £403,089.
House prices in Bexley have:
Risen by 5.0% or £19,285 over the last twelve months
Risen by 0.6% or £2,516 in the last month
Risen by 18.9% or £63,979 since the start of Lockdown One
House Prices in Barking and Dagenham
The average house price in Barking and Dagenham is £351,021.
House prices in Barking and Dagenham have:
Risen by 5.6% or £18,530 over the last twelve months
Risen by 0.9% or £3,157 in the last month
Risen by 16.9% or £50,856 since the start of Lockdown One
UK average house prices
To read our analysis of UK house prices by region click on the link below