Why house prices won’t crash next year
Codling by name, Salmon by game. I like swimming against the tide, or indeed uphill against the current. Whilst many housing market metrics are starting to point south and many commentators are predicting a house price crash, I disagree and do not think house prices will crash next year. I appreciate that I am just one voice in a turbulent sea of opinion, but in this article, I will outline why I am swimming against the tide of mainstream opinion. Twindig believes that house prices will fall by 10% next year, but housing transactions will take a much bigger hit, falling by 20%
The house prices heads-up
We do not share the view that house prices will crash (fall by 20% or more) in the coming year. We do believe that house prices will fall in 2023, but not by as much as most commentators are suggesting.
We believe that house prices may fall by 10% next year, which would take them back to levels last seen in March 2021, and around 7% or £16,000 higher than they were at the start of the COVID-19 pandemic. This is not a house price crash.
Deposits underpin house prices and drive housing transactions.
Deposits are the key to house prices
We believe that the issue facing the housing market is access to deposits. For those with access to large deposits the housing market remains affordable, but those without are finding themselves shut out.
It is much more likely, in our view, that the number of homes sold in 2023 will fall further than the prices of those homes.
Why deposits are the key to the housing market
As aspiring homeowners know only too well, house prices have become divorced from wages. In 1986 the average deposit for a first-time buyer was £3,800, their income was £11,700 and the average first-time buyer house price was £27,000, but by 2021 the deposit had increased more than 15 times to £60,000, house prices by 9 times to £242,000, but incomes had only increased by 4.5 times to £53,000.
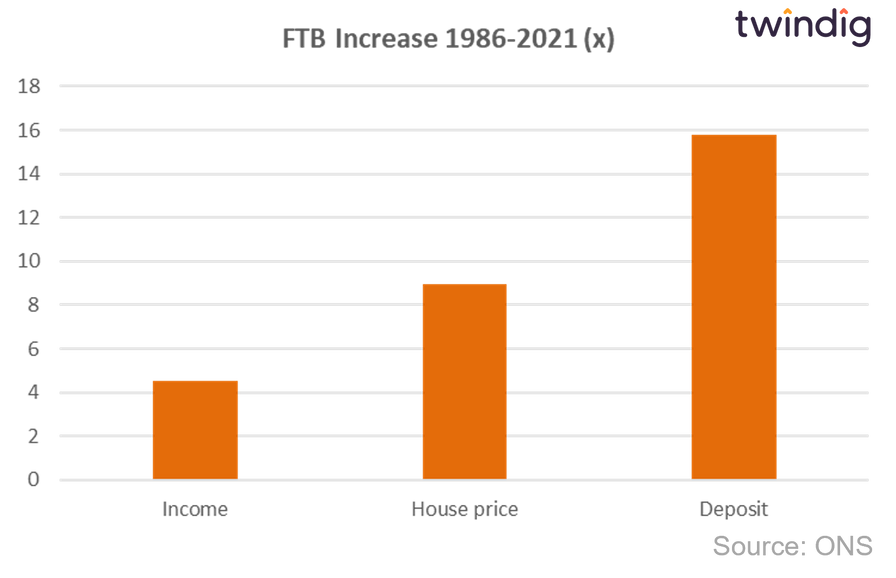
The average deposit increased from less than four months' wages to more than 13 months' wages.
The scale of the rise in deposits is very unlikely to be driven by first-time buyers saving more, but rather securing funds from other sources such as inheritances and the Bank of Mum and Dad.
We believe that access to a big enough deposit is the key factor in determining whether or not you can own your home. Increasingly first-time buyer deposits are being aided and enhanced by the Bank of Mum and Dad. Unless your parents own their home, it is unlikely that you will be able to afford one.
House prices and the two-tier housing market
The divorce between wages and house prices has created a two-tier housing market, comprising those with access to deposits and those without. House prices are too high for those without a deposit, but because they are not able to participate in the housing market they do not impact house prices in the same way that those with deposits do. Those without deposits are more likely in our view to reduce the number of housing transactions that are completed than reduce the level of house prices.
Mortgages are affordable if you can get one
The chart below shows the average First-time buyers' mortgage payments as a percentage of their monthly income.
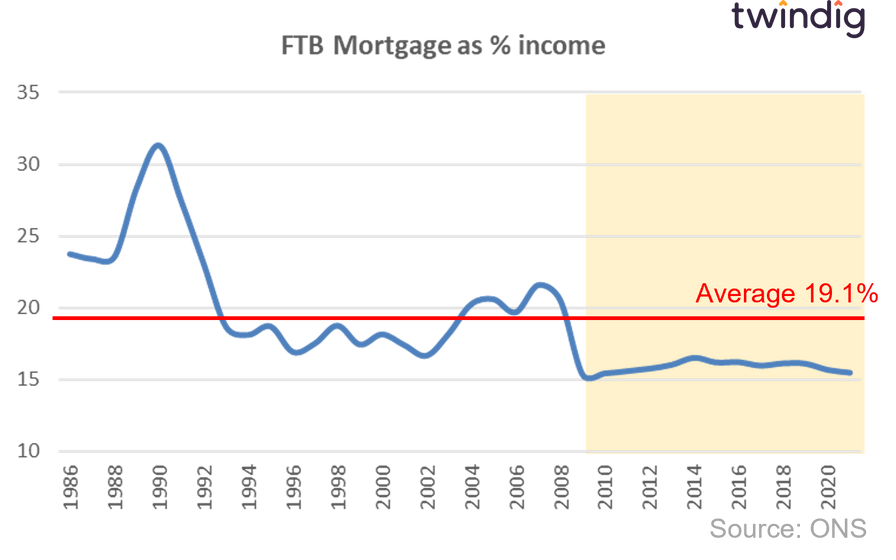
It has been remarkably stable over the last 12 years and significantly below its long-run average of 19.1%
Many suggest that rising mortgage rates will lead to house price falls, and we understand the logic, but mortgage payments are not stretching the average first-time buyer’s finances, they are currently spending 15.5% of their income on their mortgage against a long-term average of 19.1% at current wages that is a buffer of £157 per month.
Housing transactions rather than house prices will take the hit
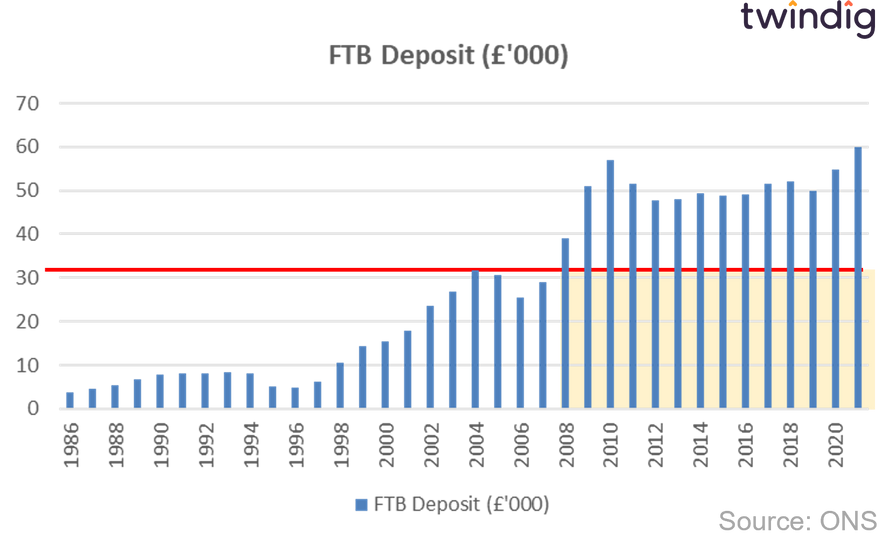
The chart below clearly illustrates what happened during the Global Financial Crisis, as deposit levels increased the number of housing transactions fell.
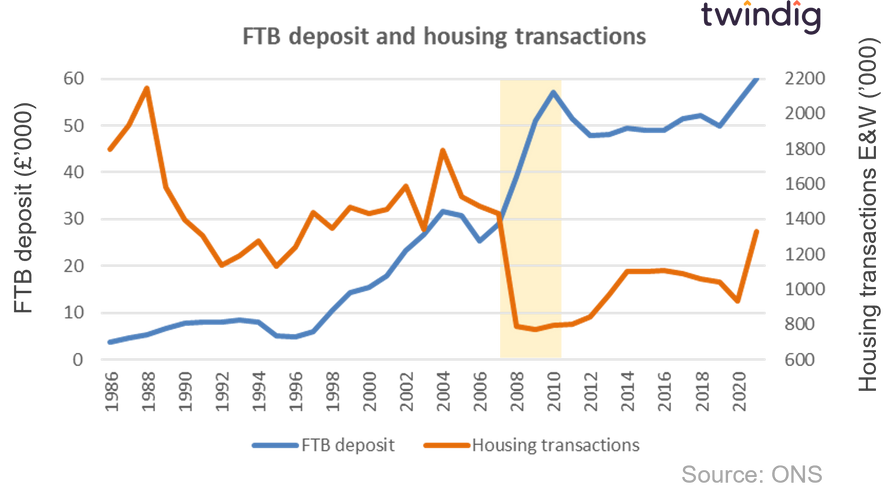
During the Global Financial Crisis, the supply of high loan-to-value mortgages reduced significantly. This meant that either house prices needed to fall or the size of deposits had to increase to bridge the gap between house prices and the available mortgage. What transpired was a bit of both, but the longer-term impact has been that deposits have remained at elevated levels and the number of transactions has not returned to pre-Global Financial Crisis levels.
The increases in deposits reduced the size of the market. House prices did not fall to maintain the size of the market, deposits rose to underpin house prices
In short, the rise in the size of deposits trumped house price falls, but with higher prices fewer can buy a home.
Our working assumption is that a similar pattern will occur in the coming months, but this time it is interest rates rising rather than the supply of mortgages falling. Those that can afford to move will move, but those that can’t won’t.
Why are fewer people moving home?
The truth is that fewer and fewer are moving home. Even with the COVID-19 stamp duty holiday fuelled housing market, housing transactions have yet to return to their pre-Global Financial Crisis levels. The 'natural' rate of home moves does change over time, and we may see another shift downwards as mortgage rates rise in our post-COVID-19 pandemic age.
In our view, the change in moving patterns reflects mortgage lending practices and house prices and their impact on necessary and discretionary moves.
In the pre-Global Financial Crisis days of easy mortgage credit, it was easier to secure a mortgage and move, so many did, making aspirational as well as necessary moves. As mortgage credit conditions tightened we believe that many of the aspirational moves fell away. If it's harder to move you are more likely to only move when you need to rather than because you want to.
As house prices surged and changes were made to the legal structure of rental tenancy agreements the private rental sector boomed, younger households stayed in rental accommodation for longer. What was once a first home is now a longer-than-planned rental and rather than a first home being a one-bed flat, older first-time buyers are jumping straight for a two or three-bed home. The growth in house prices and the letting market has taken away some of the lower rungs from the housing ladder and thereby led to a reduction in housing transactions.
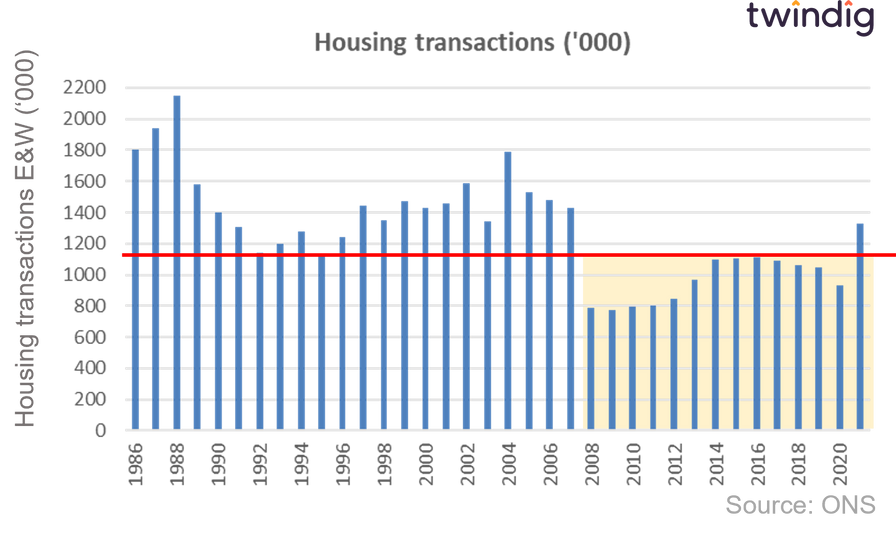
How low could housing transactions go?
During the Global Financial Crisis housing transactions in England and Wales fell by around 50% between 2007 and 2009 from 1.4 million to around 790,000. They did not return to 1 million until 2014 and in the 5 years leading up to the COVID-19 Pandemic were 15% below their long-run average.
The latest mortgage approvals data we have is 12% below its long-run average. Mortgage approvals are the key lead indicator for housing transactions.
Whilst house prices have fallen by 3.6% since their August 2022 peak, mortgage approvals have fallen by 20% (on a seasonally adjusted basis) over the same period.
We do not think it is unreasonable to think that the level of housing transactions could fall by 20% next year, double the size of the fall we are expecting for house prices.
But what about rising mortgage rates and house prices?
As we mentioned above, for those able to secure a mortgage housing is affordable. The current mortgage payment is 15.1% of the average first-time buyers' wages, compared to a long-run average of 19.1%. On current wages, this translates to a monthly mortgage payment of £843.60. If we assume a 30-year repayment mortgage, if mortgage rates increased to 4% it implies a 2% fall in house prices would be required to maintain that mortgage payment. If mortgage rates rose to 5% a 9.6% fall in house prices would be implied to maintain a monthly payment of £843.60 assuming no change to the average level of deposit.
Currently, Bank Rate is expected to peak at around 5.25% in Q3 2023, and therefore mortgage rates are likely to ease in the second half of next year, aiding affordability for those with access to deposits.
Our calculations do not assume that deposit levels increase, but during the Global Financial Crisis average deposit levels, to everyone's surprise, rose dramatically.
Most first-time buyers are currently on five-year fixed rates and can be flexible on the timing of their home purchase and are therefore likely to be able to avoid the highest mortgage rates.
Pay rises and house prices
Many sectors are currently taking strike action. Empirically pay rises normally follow inflation, we can therefore expect most sectors to see pay rises in the coming months. Mortgages are based in part on multiples of wages and therefore as pay rises start to come through the downward pressure on house prices caused by higher mortgage rates will be eased.