Average House Prices UK
The average house price in the UK is £254,624, average prices have increased by 10.0% or (£23,116) over the last year, and increased by 0.9% or (£2,241) last month
UK average house prices have increased by 10.4% (£24,137) since the start of the COVID-19 pandemic.
UK average house prices riding high.
UK house prices rose by £2,241 in May 2021 following a lull in activity in April after homebuyers rushed to meet the first of two Stamp Duty Holiday deadlines at the end of March 2021.
The price rises in May reflect a continued shortage of supply in the number of homes currently for sale. In most areas across the UK demand is greater than supply and this is putting further upward pressure on house prices.
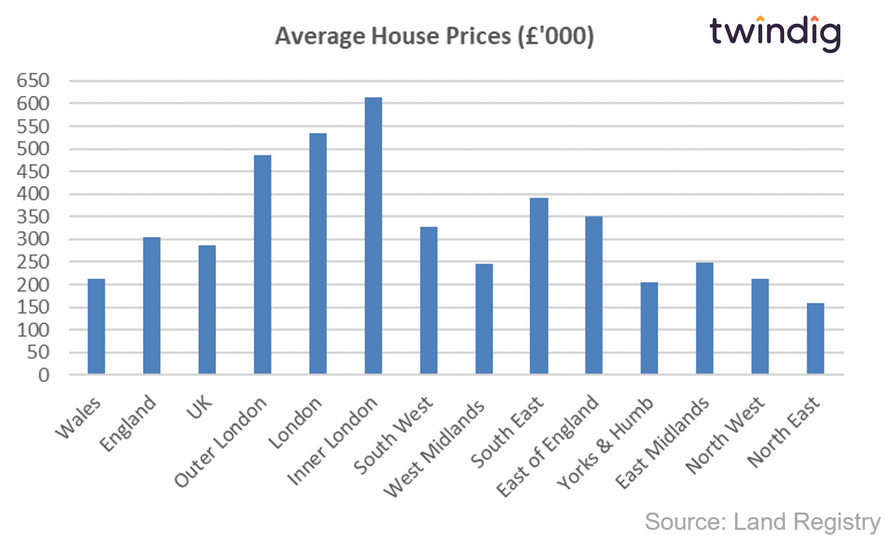
In this article we look at the house price performance of each region across England and Wales.
Whilst we often to talk about the UK Housing market as one market, it is in fact a collection of hundreds and thousands of small local markets. House prices can vary significantly between these different housing markets. We show in the table below the different house prices across the regions of England and Wales
The range of house prices is quite large from average house prices of £143,100 in the North East to average house prices of £594,600 in Inner London.
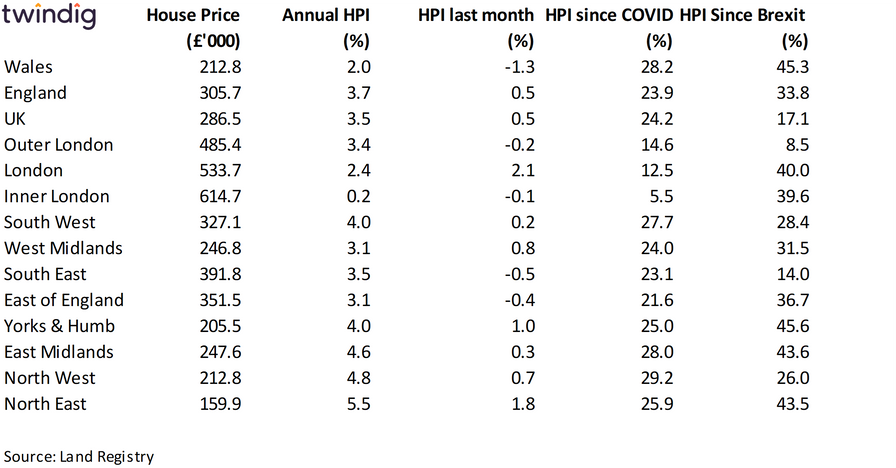
There are also regional variations in house price inflation. Over the last 12 months house price inflation across the UK was 10.0%, but varied from 2.5% in Inner London to 15.2% in the North West a reversal of the historic North South divide.
We show in the table below a summary of the regional house prices and annual house price inflation, house price inflation in the last month and house price inflation since the start of the COVID Pandemic in the UK
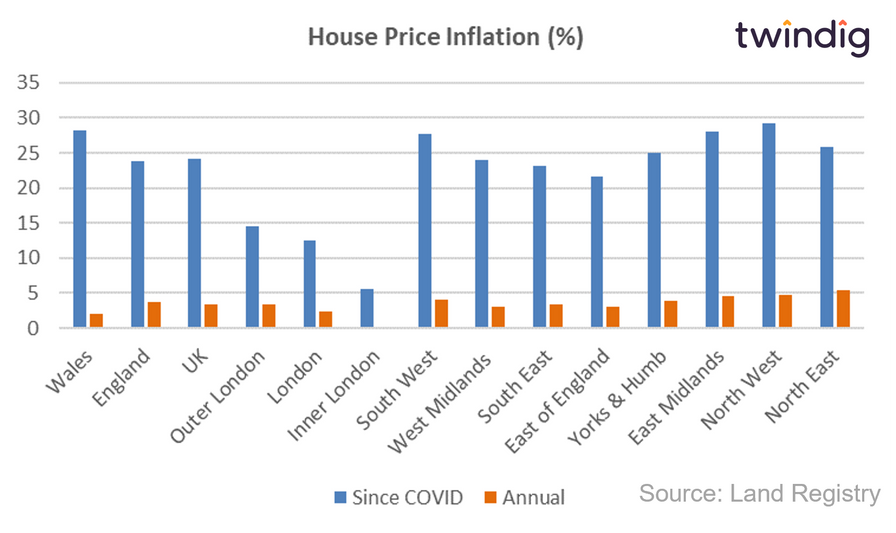
The chart below shows annual house price inflation by region in England and Wales and house price inflation since the start of the COVID Pandemic
In the chart below we show the average house price inflation by region in England and Wales since the EU Brexit referendum in June 2016. House prices have risen the most in the East Midlands up 27.7%, the North East up 27.4% and Yorkshire and Humbeside up 27.0%.
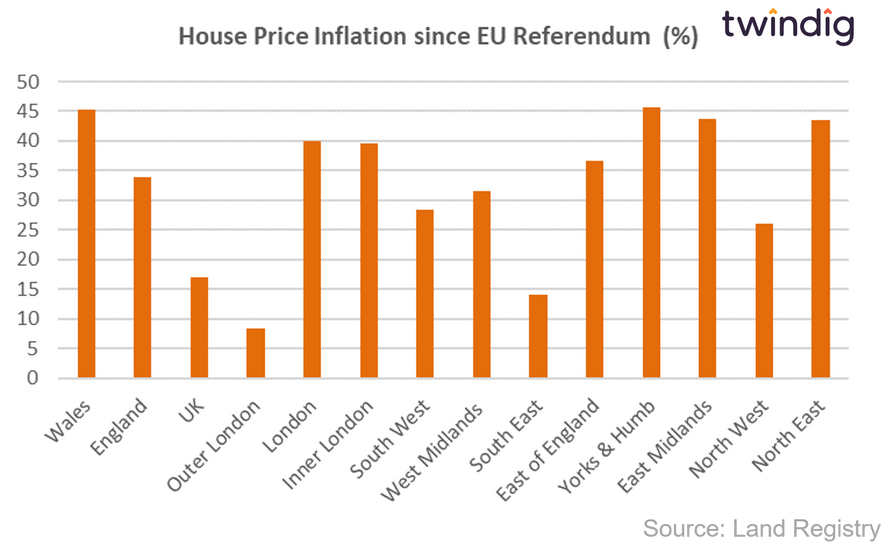
House prices have risen the least in Outer London up 4.9% and the South East up 6.4% since the EU Brexit Referendum.
The changes in average house prices since the EU Brexit Referendum broadly reflect the regional voting patterns with higher house price inflation in those regions with a strong leave vote and lower house price inflation with a stronger remain vote.
How much is my house worth?
If you would like to quickly see how much your house is worth you can do so by visiting twindig.com we have details of every house across the country, all 28 million, not just the one million or so that are currently for sale or rent
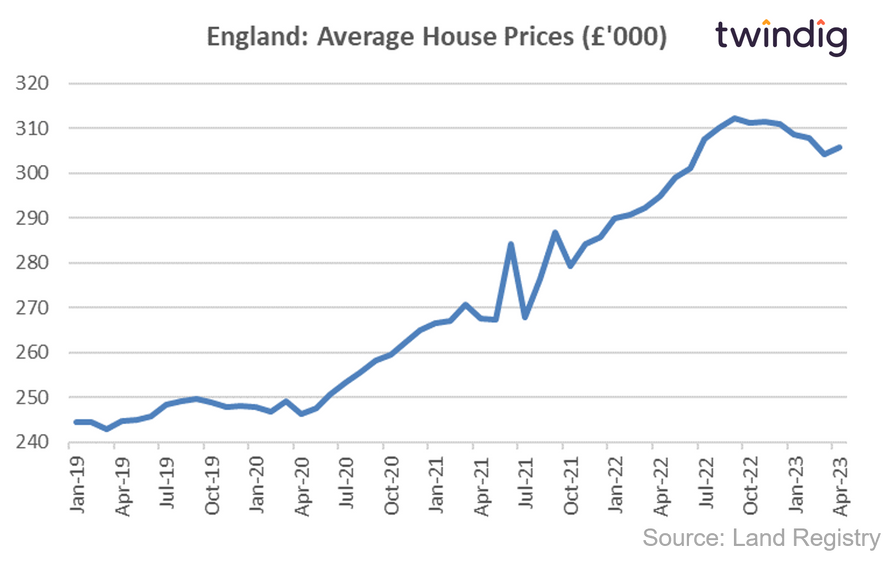
House prices in England
The average house price in England is £271,400. House prices in England have increased by 9.7% over the last year, increased by 0.4% over the last month, increased by 10.0% since COVID and are up 18.8% since the EU Brexit Referendum.
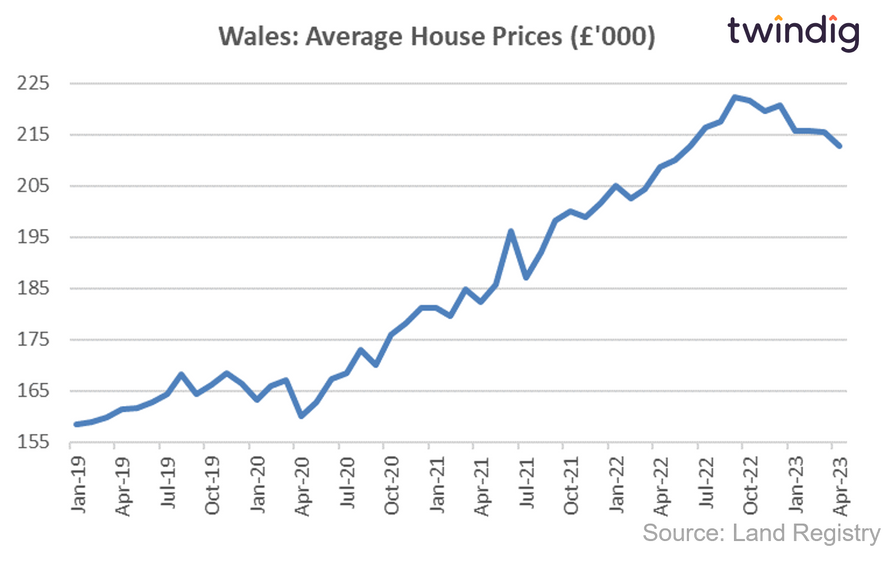
House prices in Wales
The average house price in Wales is £184,300. House prices in Wales have increased by 13.3% over the last year, risen by 0.8% over the last month, increased by 11.1% since COVID and by 25.8% since the EU Brexit Referendum.
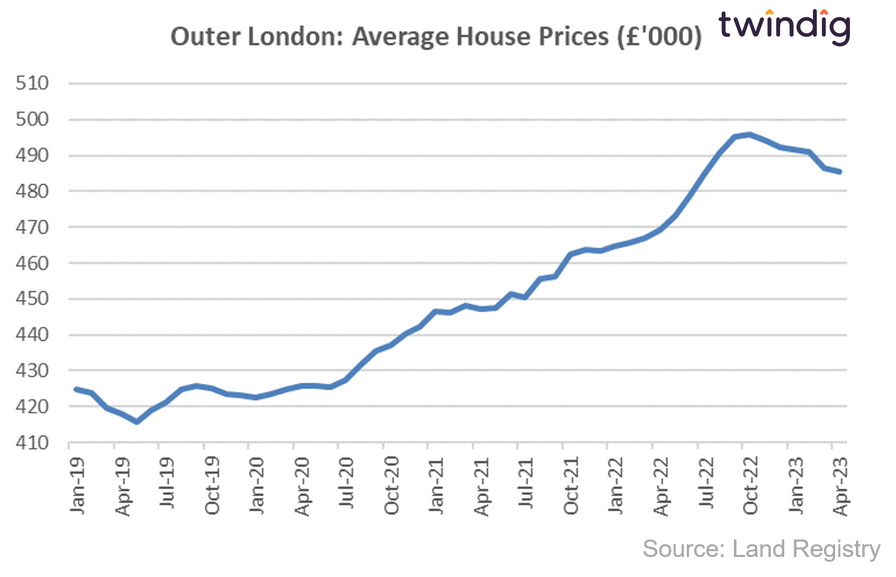
House prices in Outer London
The average house price in Outer London is £453,900. House prices in Outer London have increased by 6.6% over the last year, risen by 0.4% over the last month, risen by 7.1% since COVID and by 4.9% since the EU Brexit Referendum.
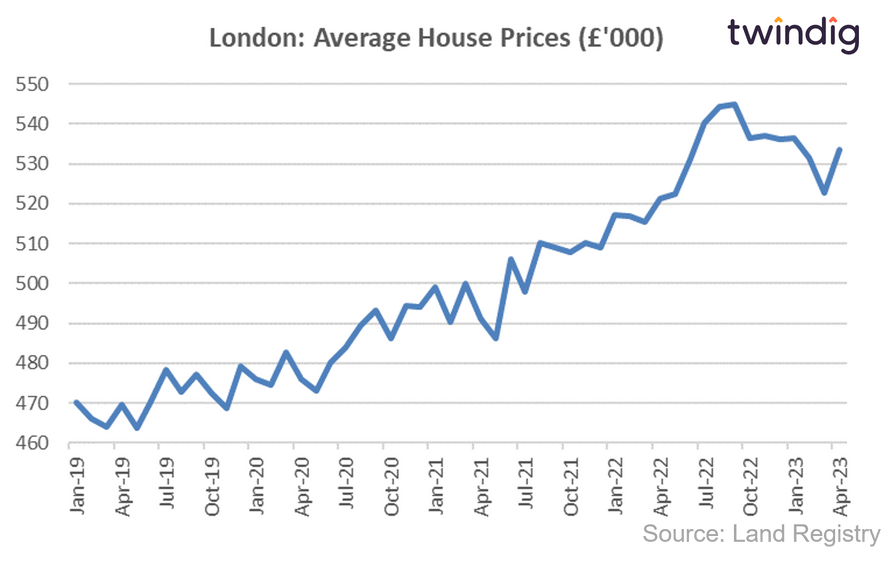
House prices in London
The average house price in London is £497,900. House prices in London have increased by 5.2% over the last year, fallen by 0.7% over the last month, increased by 4.9% since COVID and by 18.8% since the EU Brexit Referendum.
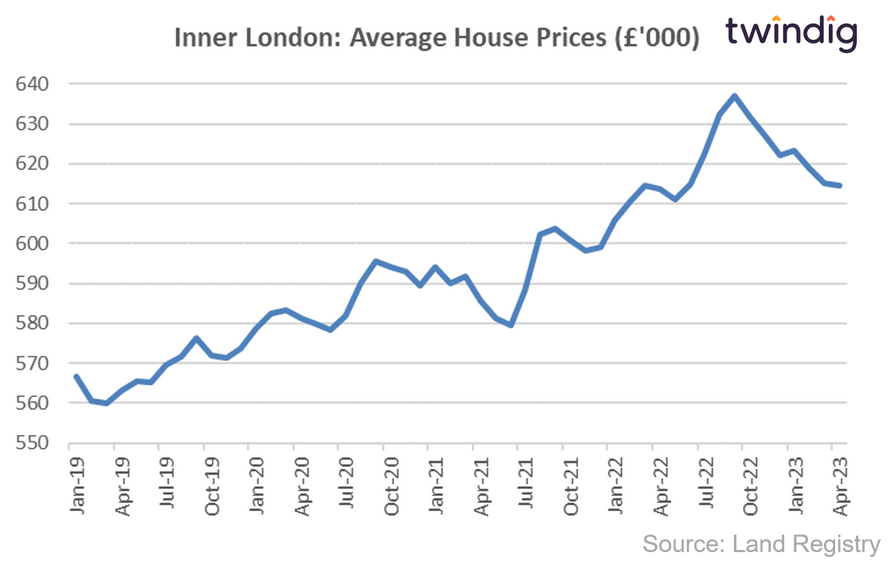
House prices in Inner London
The average house price in Inner London is £594,600. House prices in Inner London have increased by 2.5% over the last year, increased by 0.2% over the last month and increased by 2.1% since COVID and by 24.4% since the EU Brexit Referendum.
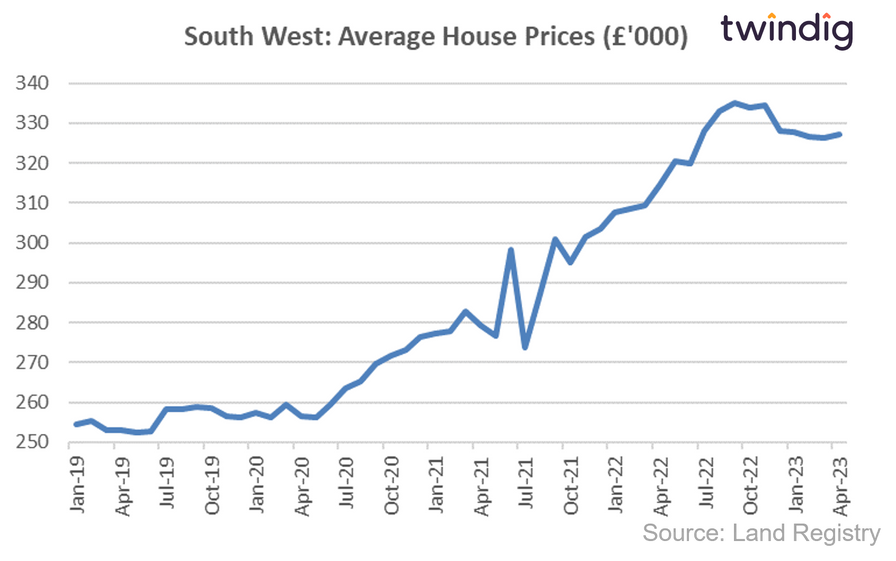
House prices the South West
The average house price in the South West is £277,600. House prices in the South West have increased by 8.4% over the last year, fell by 0.6% over the last month and increased by 8.4% since COVID and by 14.7% since the EU Brexit Referendum.
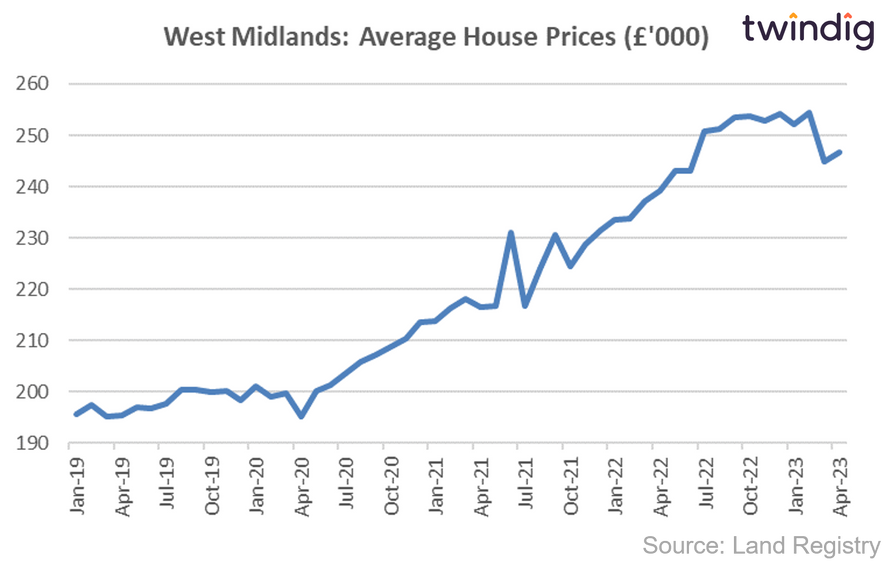
House prices the West Midlands
The average house price in the West Midlands is £219,800. House prices in the West Midlands have increased by 9.8% over the last year, risen by 0.8% over the last month and increased by 10.5% since COVID and by 16.0% since the EU Brexit Referendum.
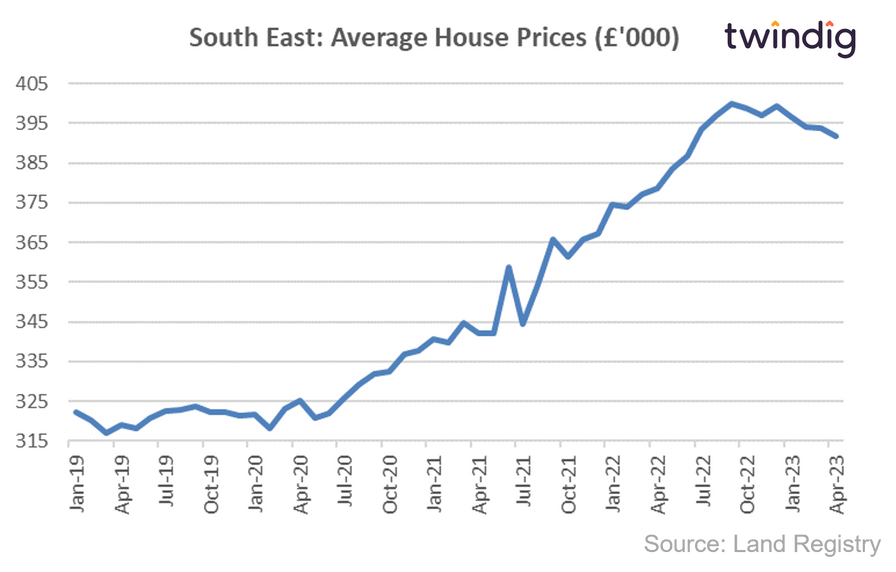
House prices the South East
The average house price in the South East is £350,000. House prices in the South East have increased by 9.1% over the last year, risen by 1.4% over the last month and increased by 10.0% since COVID and by 6.4% since the EU Brexit Referendum.
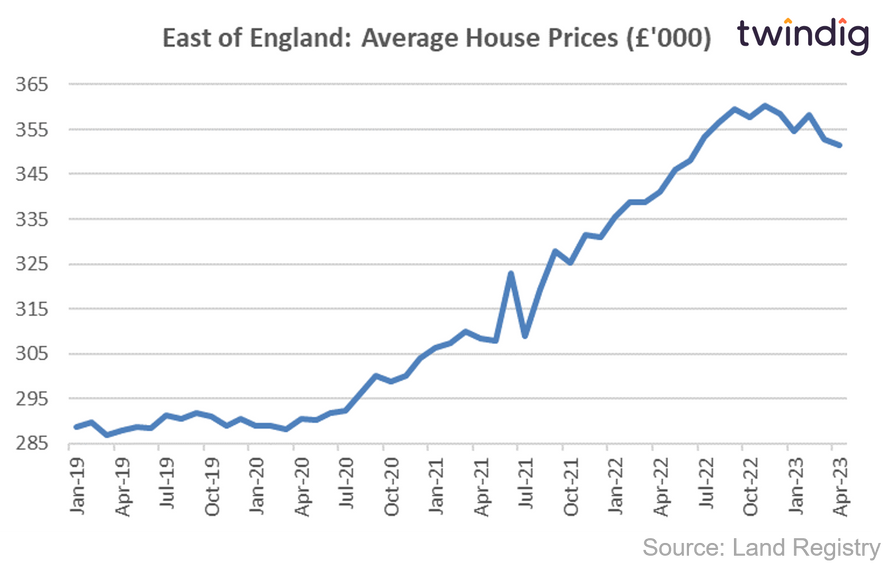
House prices the East of England
The average house price in the East of England is £310,200. House prices in the East of England have increased by 6.9% over the last year, fallen by 1.0% over the last month and increased by 7.3% since COVID and by 21.0% since the EU Brexit Referendum.
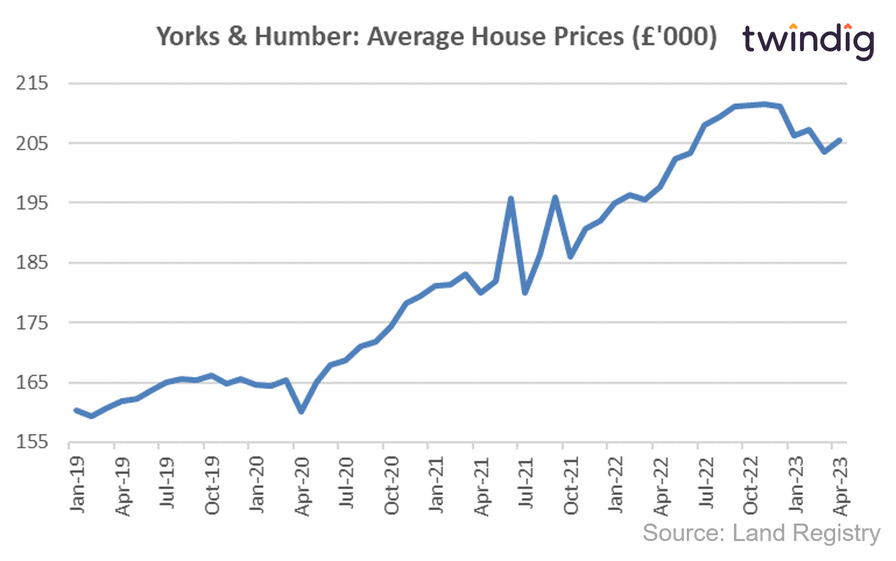
House prices Yorkshire and Humberside
The average house price in Yorkshire and Humberside is £181,900. House prices in Yorkshire and Humberside have increased by 10.2% over the last year, risen by 0.8% over the last month and increased by 10.6% since COVID and by 27.0% since the EU Brexit Referendum.
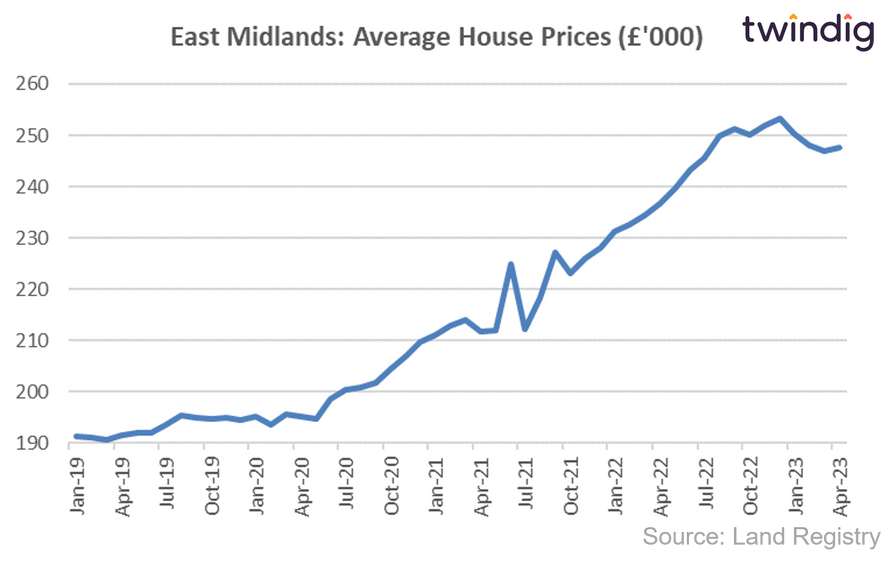
House prices in the East Midlands
The average house price in the East Midlands is £216,100. House prices in the East Midlands have increased by 11.0% over the last year, fell by 0.2% over the last month and increased by 11.7% since COVID and by 27.7% since the EU Brexit Referendum.
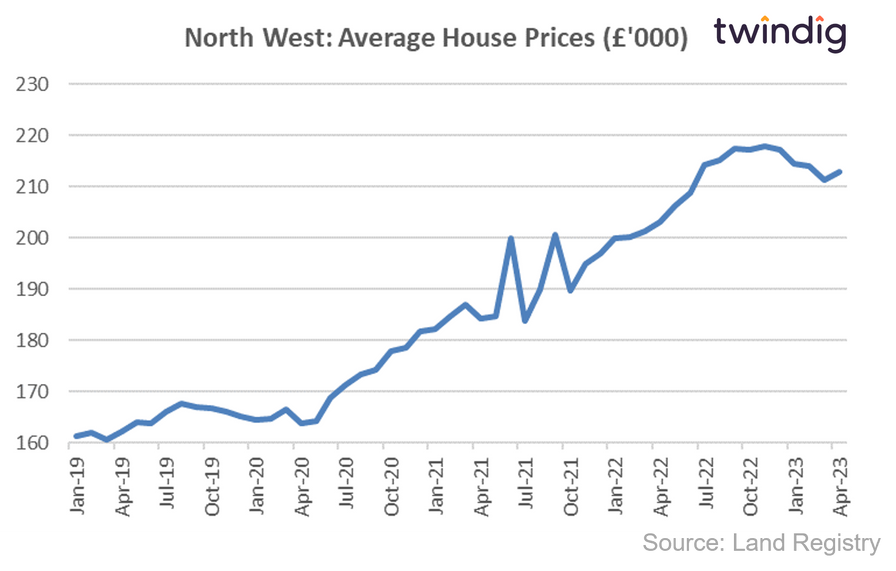
House prices in the North West
The average house price in the North West is £189,200. House prices in the North West have increased by 15.2% over the last year, risen by 1.4% over the last month and increased by 14.9% since COVID and by 12.8% since the EU Brexit Referendum.
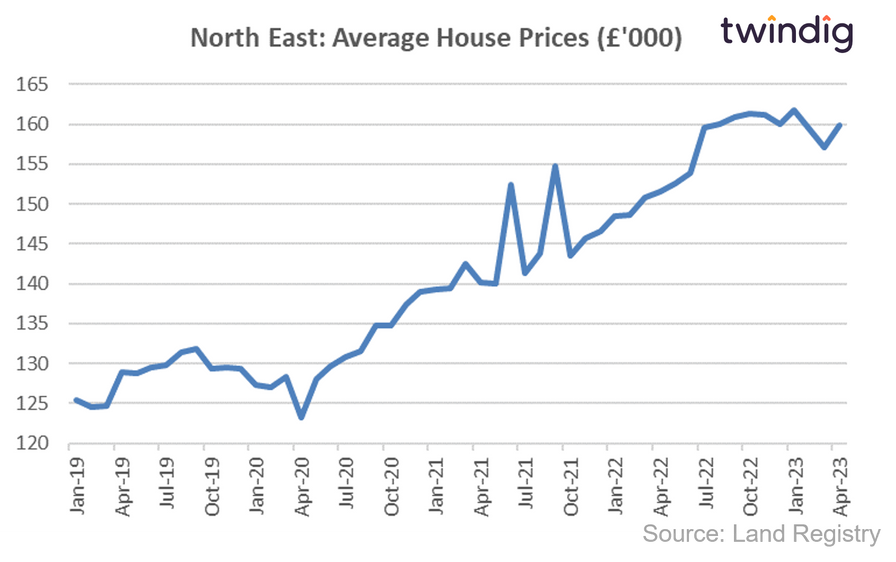
House prices in the North East
The average house price in the North East is £143,100. House prices in the North East have increased by 11.8% over the last year, risen by 1.4% over the last month and increased by 12.7% since COVID and by 27.4% since the EU Brexit Referendum.
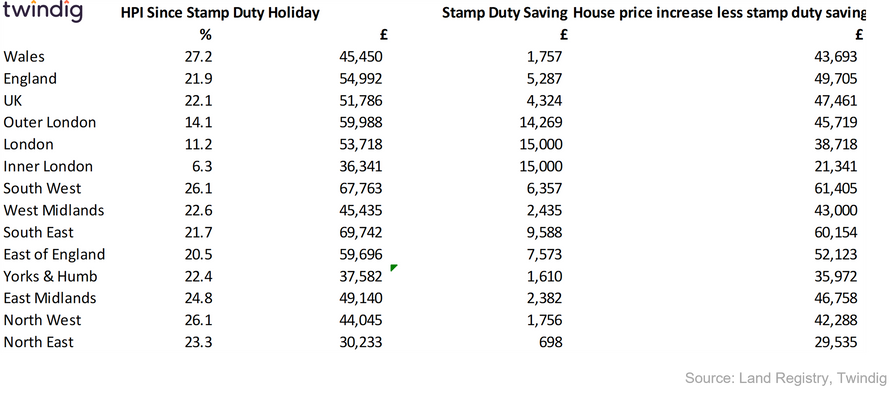
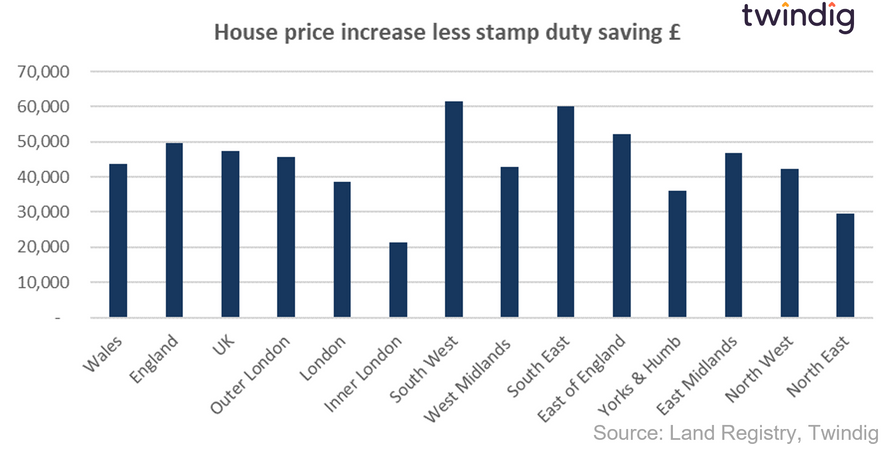
Average UK House Prices and Stamp Duty Holiday
The average house price in the UK has increased by £19,845 since there start of the Stamp Duty Holiday to £250,800 which equates to a Stamp Duty saving of £2,539.
The average UK house price has therefore increased by £13,477 more than the potential Stamp Duty since the start of the Stamp Duty Holiday.
We show the change in house prices and stamp duty savings in the table below and also a chart show how much more average house prices have increased than the potential stamp duty saving