Houselungo 20 February 22

Help to Green: When climate, pensions and property collide

The climate is heating up, house prices are going up and the pension ticking timebomb is about to blow up.
The UK Government has a target to reach net zero emissions by 2050
Government Data states that:
UK homes are responsible for 15-22% of greenhouse gas emissions
Fewer than 40% of homes in the UK have an Energy Performance Certificate (EPC) rating of C or better.
The average UK pension pot at retirement is around £62,000
For many in the UK, homeownership is out of reach as the average home costs around £280,000
In the article below, we look at how these three disparate problems collide and how they might join together to solve all three problems at once. We briefly look at each problem in isolation before identifying the common thread that might lead us to the solution for pensions, property and the planet. We think that our suggested solution will be of interest to property investors, aspiring first-time buyers and environmentally conscious investors alike.
Latest regional house price trends
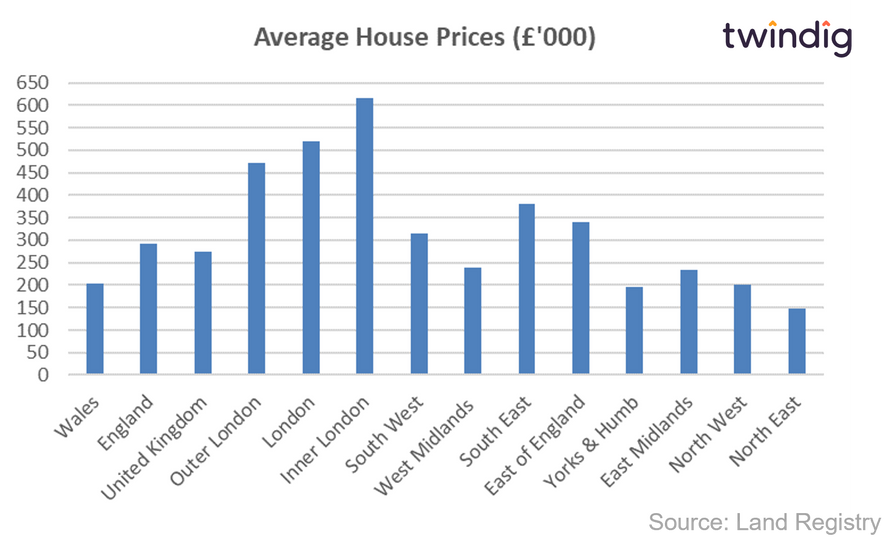
The average house price in the UK is £274,712, average prices have increased by 10.8% or (£26,729) over the last year, and increased by 0.8% or (£2,296) last month. We note that these figures are provisional and subject to change, however, October is the first month following the end of the Stamp Duty holiday, and a month in which the UK housing market paused for breath.
UK average house prices have increased by 19.1% (£44,103) since the start of the COVID-19 pandemic.
House prices quickly recover from stamp duty holiday blues
UK house prices rose in all regions apart from the North East in December 2021, rising on average by £2,2296 as the UK housing market got back into its stride following the end of the Stamp Duty Holiday.
It is comforting that house prices, in most areas, returned to growth so quickly after the benefits of the stamp duty holiday had been taken away. We already know that housing transactions have bounced back following a brief pause for breath and it seems that house prices are following suit.
We continue to believe that in the medium-term demand will outstrip underpinning house prices.
In this article below, we look at the house price performance of each region across England and Wales.
The UK's 25 hottest housing markets
We often talk about 'the UK housing market' and 'UK house price inflation' as if there is one housing market and one rate of house price inflation. Neither is true.
The UK is made up of hundreds if not thousands of tiny housing markets, which operate independently of each other. One person buying a home in Swindon does not move the housing market in Stockwell.
In this article, we look at the hottest 25 housing markets across the country.
Biggest house price increases last month
The biggest house price winner last month was the City of London where house prices increased by 8% a huge £64,200.
In second place came North Devon where house prices increased by 5.6% and in third place with house prices rising by 5.5% was Neath Port Talbot in Wales.
Good to see that three different regions make up the top three, but do you live in one of the 25 UK's hottest housing markets? Or do you reside in one of the only two housing markets to have seen house prices fall since the first lockdown? Read the article below to find out
London house prices continue to rise
The latest data from the Land Registry shows that the average house price in London rose by 0.2% or £1,242 to £521,146 in December 2021. House prices rose in 22 of the 34 London boroughs during December.
The biggest rises were in the City of London up £64,222 (8.0%), the CIty of Westminster up £38,233 (3.8%) and Camden up £36,511 (4.2%).
The biggest London house price falls last month were to be found in Kensington & Chelsea down £53,520 (3.7%), Kingston upon Thames down £8,334 (1.5%) and Haringey down £7,019 (1.2%).
House Prices in London
The average house price in London is £521,146. This is 78% or £227,807 higher than the £293,339 average house price in England.
House prices in London have risen by 5.5% over the last twelve months compared to an average increase in house prices across England of 10.7%.
In absolute monetary terms, this translates to an average increase of £26,953 in London and £28,368 in England. House prices in England have therefore increased more in relative and absolute terms than they have in London over the last 12 months.
To see the house prices and house price trends by London borough keep reading, you will find all that house price data in the body of this article.
Twindig Housing Market Index
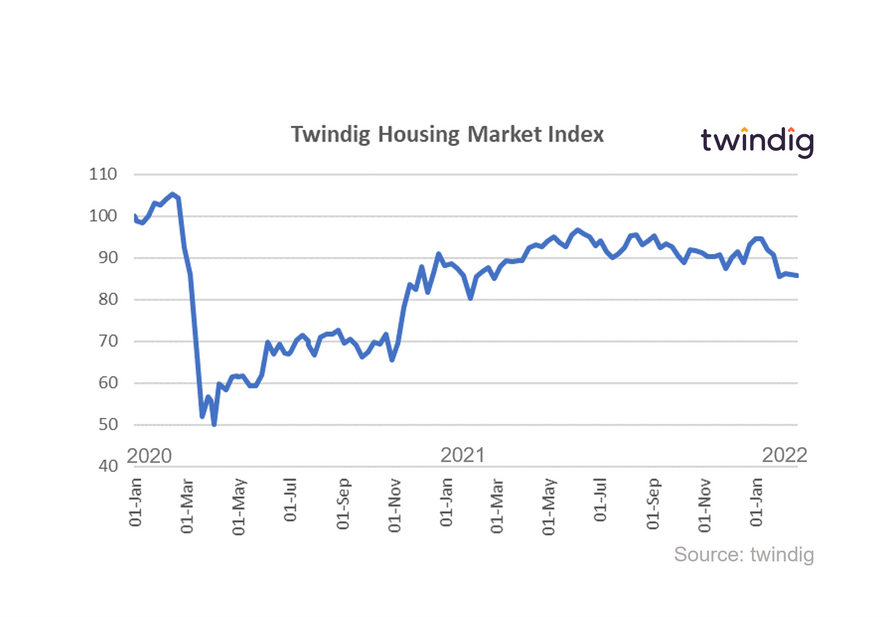
In the week where the Land Registry reported rising house prices, the Twindig Housing Market Index nudged down for a third week in a row falling by 0.8% to 85.8.
The prospect of additional cladding taxes on the large housebuilders coupled with the prospect of further Bank Rate rises saw investor confidence dip with respect to housebuilders and mortgage lenders. Cost of living increases remains a theme being pondered and investors were slightly subdued as they headed off for the half term and filled their cars with incredibly expensive fuel.
The Help to Buy statistics released on Thursday were a mixed bag, the rule changes are having an impact. The average price of homes purchased through the scheme is falling as the regional price caps bite, and first-time buyers no longer have to compete against existing homeowners when trying to get a foothold on the Help to Buy housing ladder. However, the number of first-time buyers actually fell, suggesting that the rule changes may not actually have helped to turn generation rent into generation buy.