The UK's 25 hottest housing markets
House price winners
We often talk about 'the UK housing market' and 'UK house price inflation' as if there is one housing market and one rate of house price inflation. Neither is true.
The UK housing market is made up of hundreds if not thousands of tiny housing markets, which operate independently of each other. One person buying a home in Sidmouth does not move the housing market in Skegness.
In this article, we look at the hottest 25 housing markets across the country. Do you live in one of the UK's hottest housing markets and if you do how much have house prices increased?
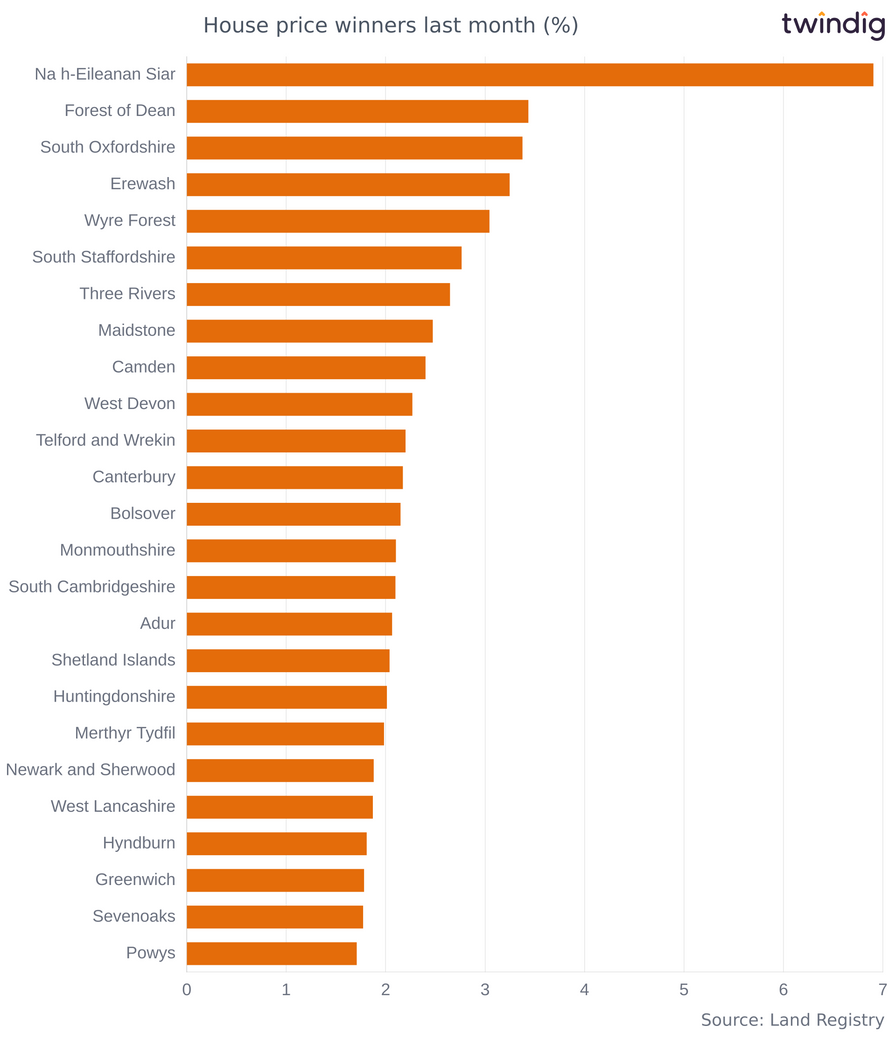
Biggest house price increases last month
The biggest house price winners last month were in Na h-Eileanan Siar where average house prices increased by 6.9%.
In second place came Forest of Dean where house prices rose by 3.4%, and in third place where house prices were up by 3.4% was South Oxfordshire.
Interesting to see that the top three came from across the country.
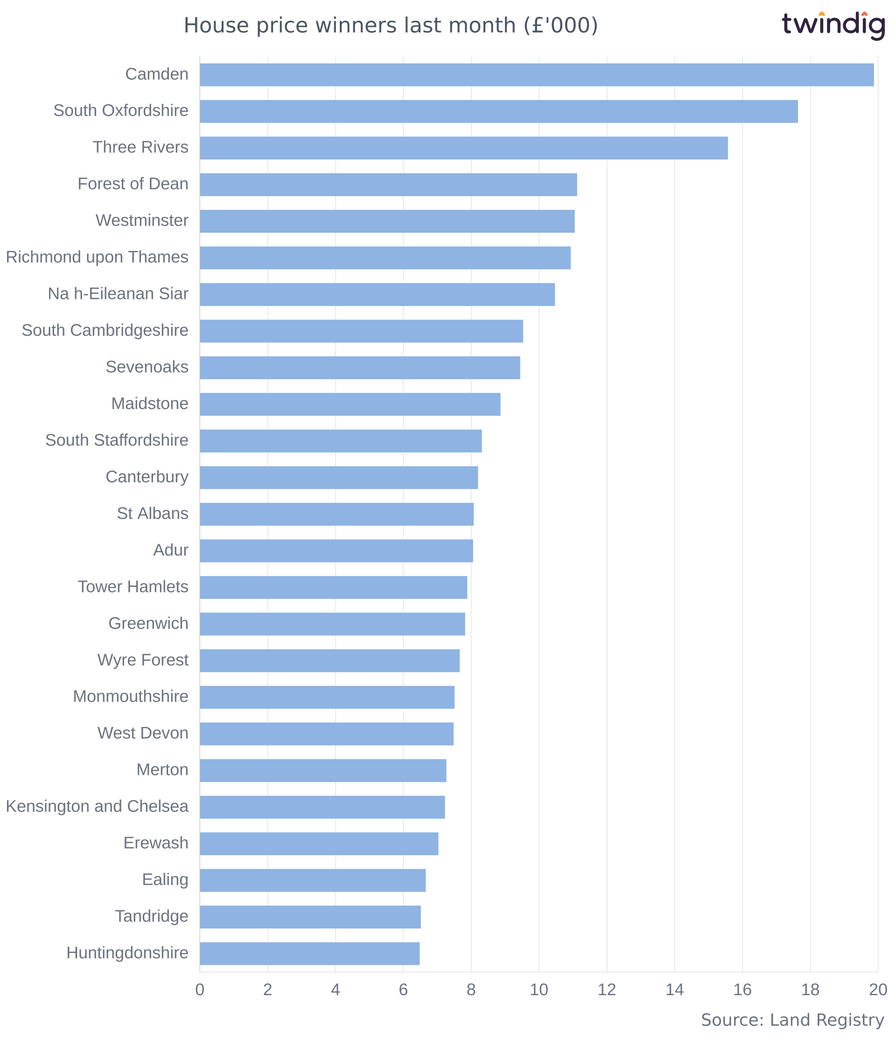
House price winners last month - absolute money terms
If we look at house price growth in absolute, money terms, the winner was Camden where house prices climbed £19,870 followed by South Oxfordshire which saw house prices increased by £17,630 and making up the podium was Three Rivers where house prices rose by £15,560.
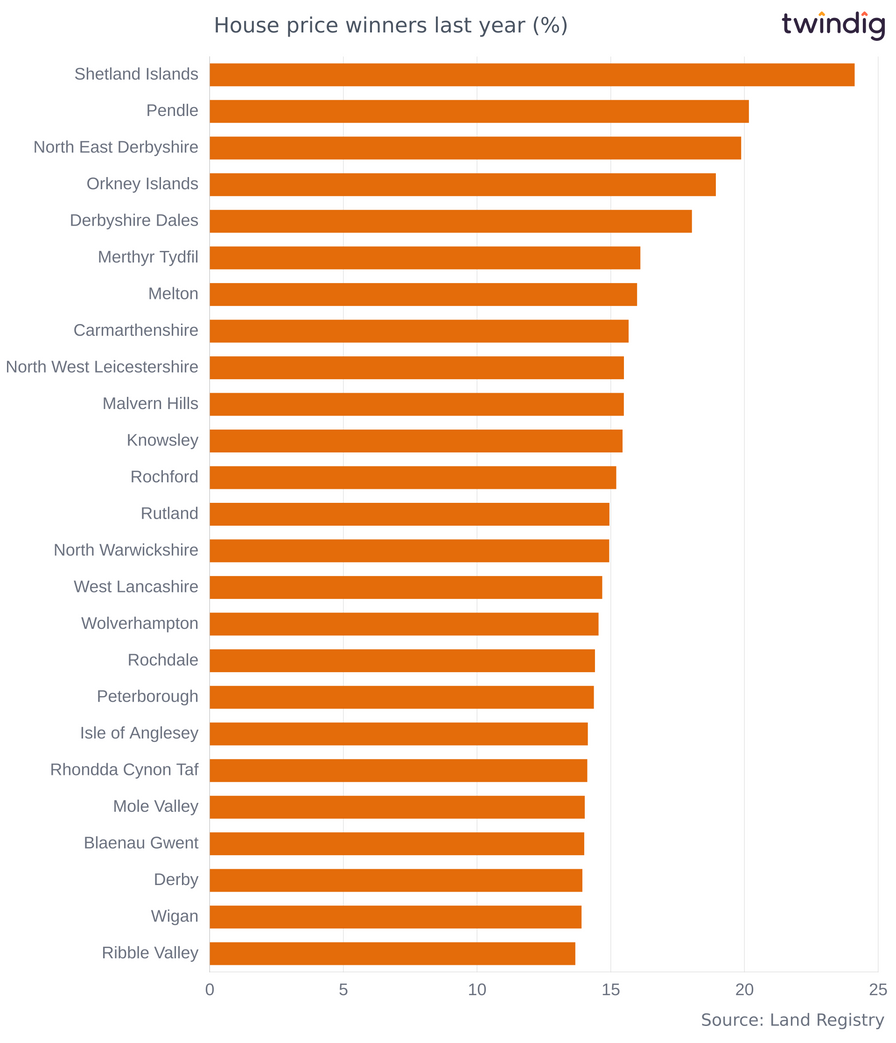
Biggest house price increases last year
If we look at house price growth over the last twelve months, we also see a picture of winners spread across the country.
House prices in Shetland Islands were up by 24.5%, Carmarthenshire saw house prices increase by 14.8% and in third place was Fylde where house prices have risen by 14.2%.
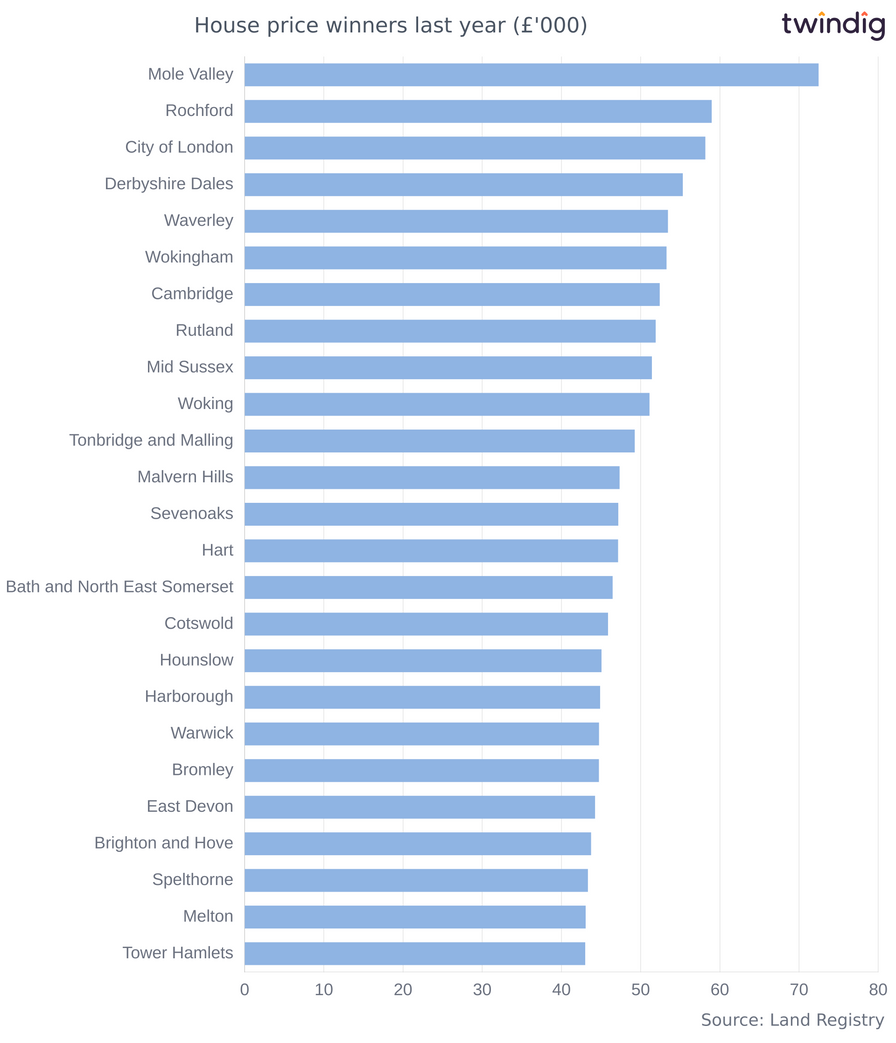
House price winners last year - absolute money terms
However, when it comes to absolute house price rises City of London takes the honours seeing house prices increase by £113,500. In second place was South Oxfordshire which saw average house price gains of £57,680, with Rochford in third place where average house prices have risen by £54,220.
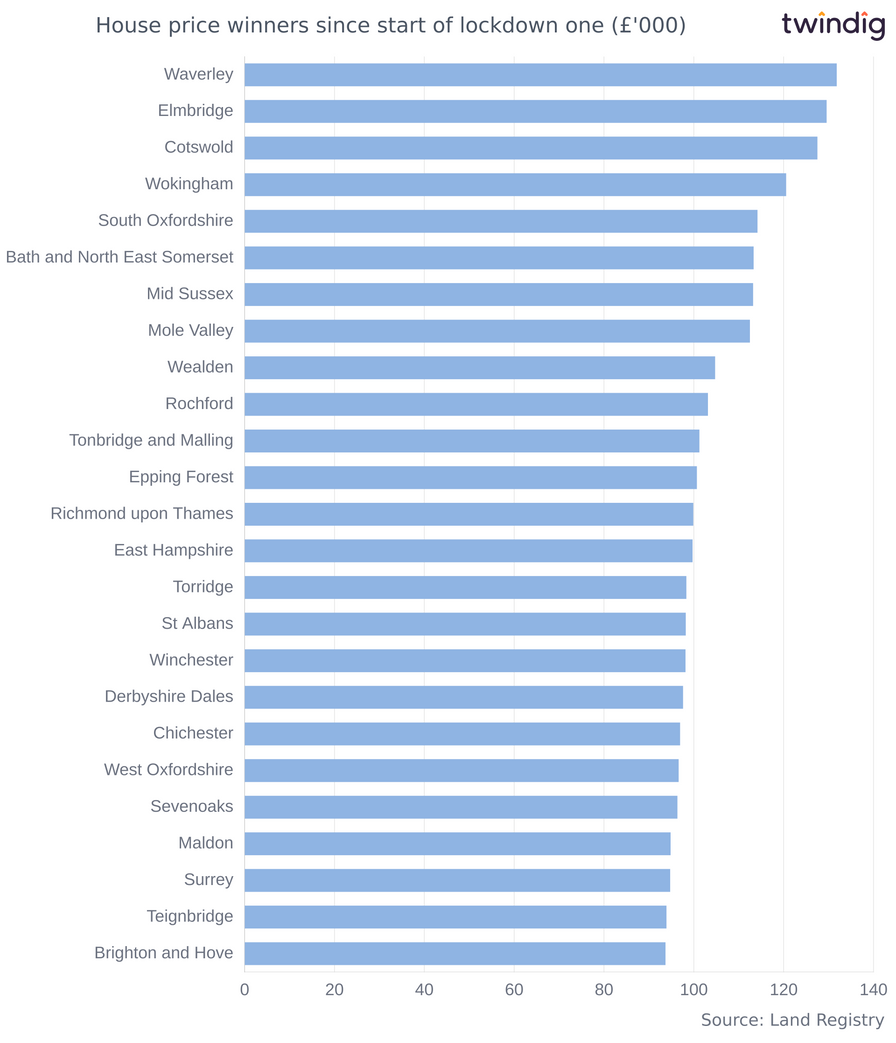
Lockdown house price winners
If there is a silver lining to the lockdown cloud then many homeowners certainly enjoyed a lot of the available silver lining.
House prices in City of London have increased by £161,300 since the start of lockdown one, house prices in Elmbridge have increased by £133,600, and in third place, South Oxfordshire, where house prices have increased by £130,300 since the start of lockdown one.
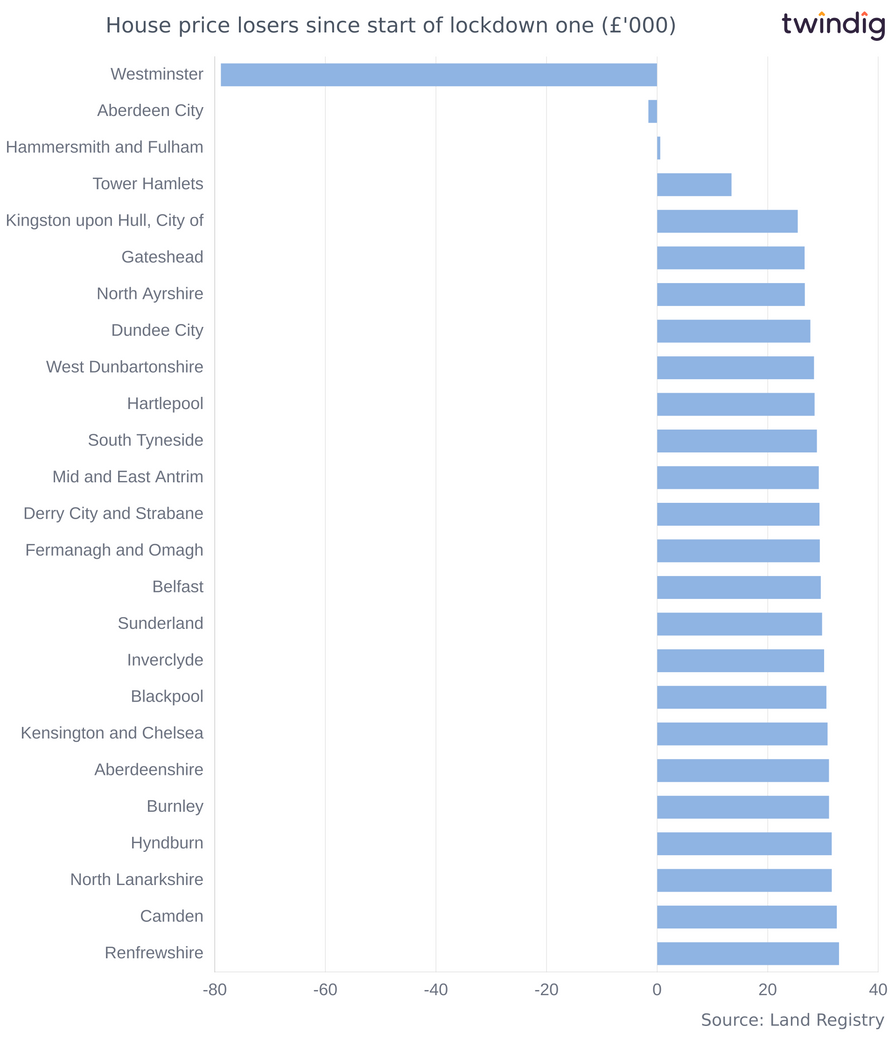
If we look at the bottom end of the league table, we see Westminster, where average house prices have decreased by £45,340 followed by Aberdeen City, where average house prices have decreased by £10,320 since the start of lockdown one and in third place Kensington and Chelsea, where house prices have decreased by £230 since the start of lockdown one.
If you would like to see how much your home might be worth why not join the growing twindig community, and we will send you a free monthly home valuation report and update you on house prices and the housing market where you live.
Sign up for our newsletter to keep up to date on the hottest UK housing markets and a weekly summary of all the key housing market news