Housing affordability can you join the dots?
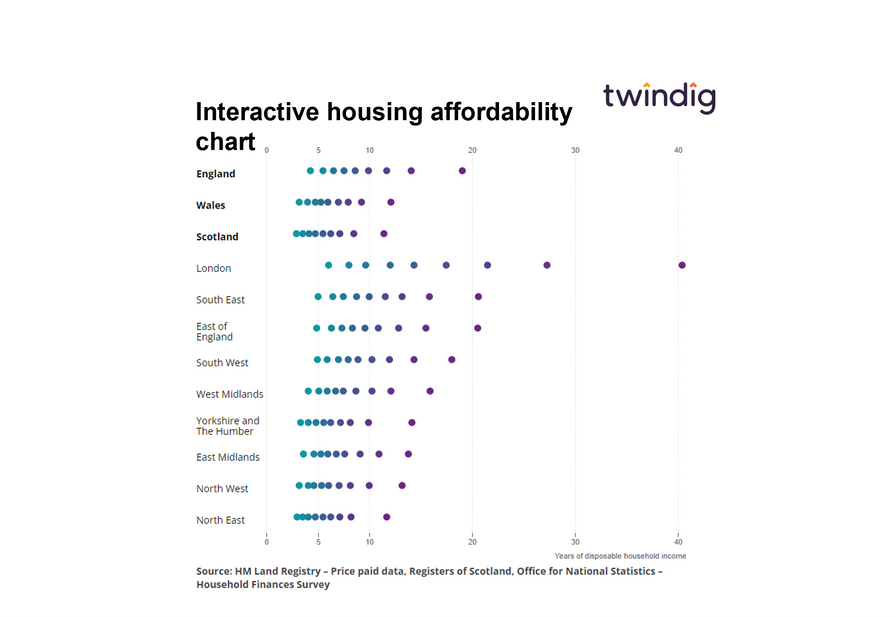
Interactive housing affordability chart
Number of years of income to purchase the average home by income decile
Whilst the interactive chart above may look like something from The Matrix, unfortunately, it is science fact, not fiction. The chart shows the house price-earnings ratio by income decile for the averagely priced home. Whilst many charts paint a picture of affordability, this one clearly presents the stark and chilling reality that property ownership is increasingly for the few, not the many.
What has caused the housing affordability problem?
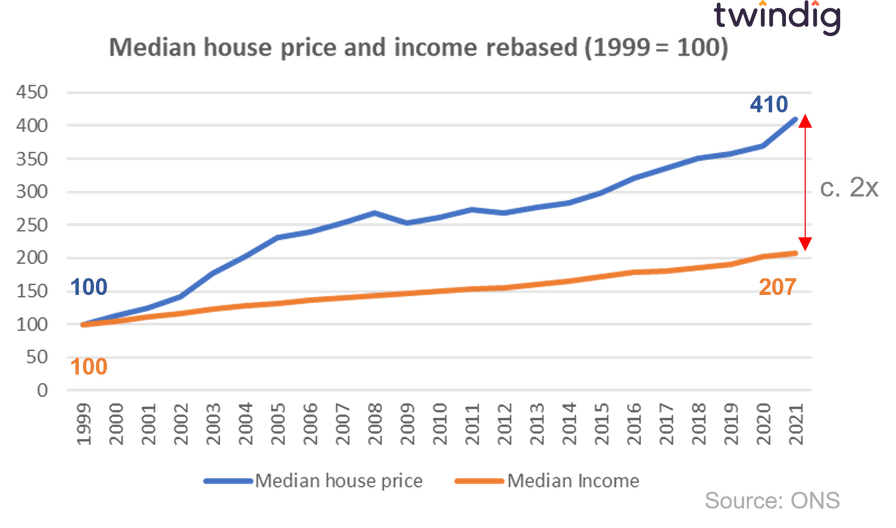
Simply put, house prices have grown at a much faster rate than wages, between 1999 and 2021 average wages doubled, but the average house prices have quadrupled. Average house prices have increased by almost twice the amount that wages have. This has put homeownership out of the reach of many aspiring first-time buyers.
How did houses become so unaffordable?
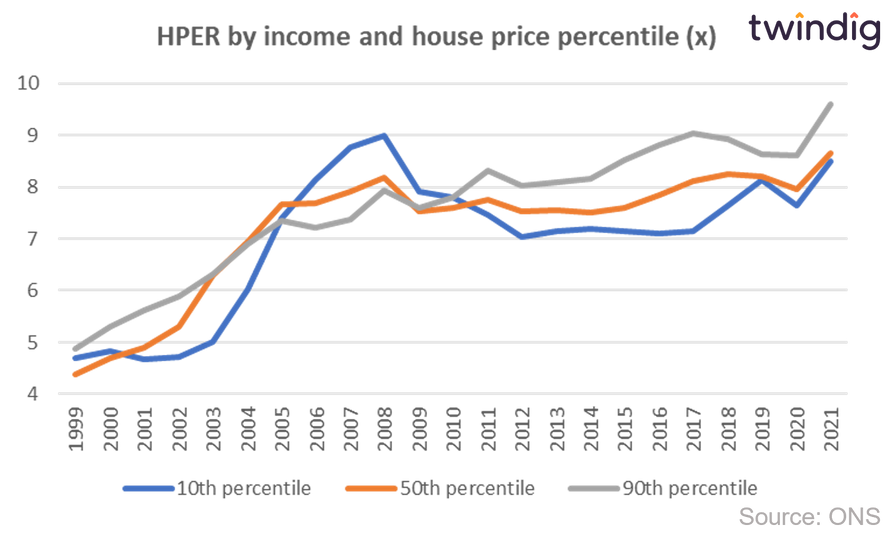
Focusing on the House Price Earnings Ratio (HPER) we can see from the graph below that affordability worsened considerably in the early 2000s, and plateaued for a few years before rising again during the COVID-19 pandemic.
We show in the graph below the HPER for the 10th 50th and 90th income percentiles purchasing a home in the same percentile, it appears that affordability followed a similar pattern for the lower, middle and higher rungs of the housing ladder and income scales.
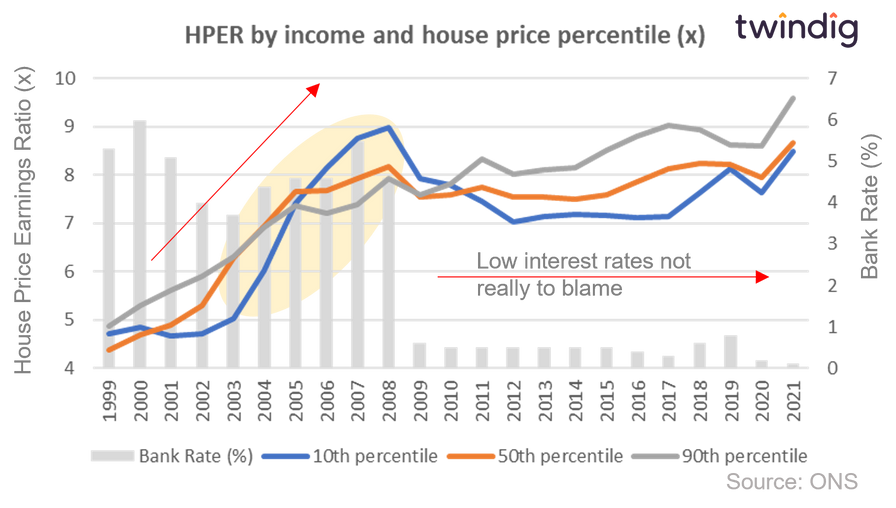
Many have suggested that the expansion of credit and falling interest rates led to the surge in house prices, but if we overlay Bank Rate onto the HPER graph (as we do below) you can see that this is not the case. Affordability fell before Bank Rate did and affordability levels were relatively stable during the period of low Bank Rate until the COVID-19 pandemic struck.
We believe that the divorce between house prices and wages has been caused by intergenerational wealth transfers or to give it its more common name, the bank of mum and dad, which estate agent Savills believe lent £9.8bn in 2021 lending £58,000 on average to a large number of fortunate children and grandchildren.
What is the answer - how do we level up the housing market?
In our view, we level up the playing field by opening the surrogate bank of mum and dad or the adoptive bank of mum and dad where unrelated people help first-time buyers to get a foot on the housing market. We would like to see a true property ISA where the ISA savings are used to provide deposits for first-time buyers, helping them buy a home, and letting both buyers and savers benefit from house price rises. We call this fractional homeownership
For a more detailed discussion about housing afford affordability you can read our report We need to talk about housing affordability by clicking read more below: