We need to talk about housing affordability

Data just released from Nationwide highlights the growing housing affordability crisis. Whilst for many rising house prices have been a silver lining in a dark and grey COVID cloud, for others it has only made a dark day darker.
Whilst we often view the UK as a nation of homeowners, we are rapidly becoming a nation of the haves and have nots when it comes to homeownership, and rising house prices exacerbate this thorny issue. As affordability gets ever more stretched the importance of securing a large deposit increases and this is often the final and biggest homeownership hurdle to clear.
Putting it bluntly the house price-earnings ratio (HPER)
The House Price Earnings Ratio is a blunt tool. It takes two figures: house prices and earnings (wages or salary) and divides one by the other. The result is how many salary years it would take to buy a home.
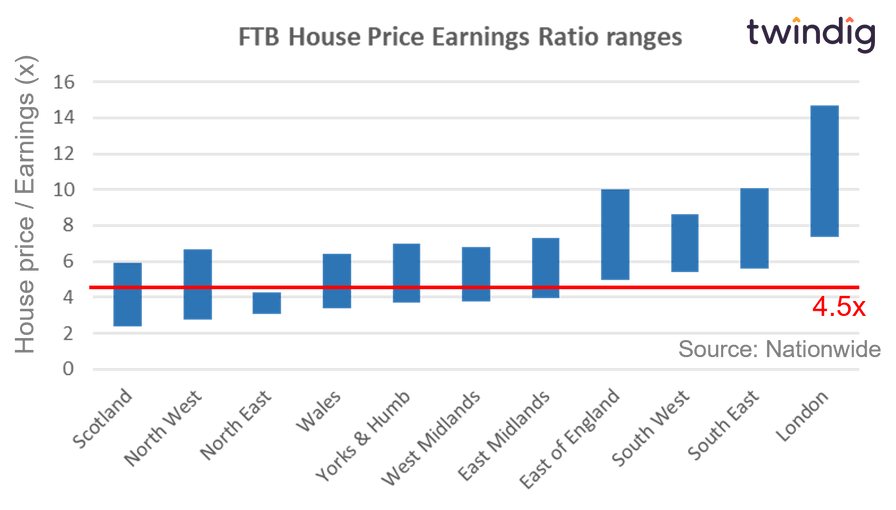
We show in the graph below data from Nationwide showing the range of House Price Earnings Ratio (HPER) by local authority in each region of the UK.
Scotland has the most affordable local authority East Ayrshire with an HPER of 2.4x and London the least affordable, Kensington and Chelsea at an eye-watering 14.7x.
HPER and Loan To Income
One of the key affordability metrics used by mortgage lenders is the ‘Loan to Income’ (LTI) ratio. This ratio is the size of the loan or mortgage divided by your income. It is therefore very similar to the HPER and this is important because no more than 15% of mortgages issued by lenders can be above an LTI of 4.5x. This becomes an issue where the average house price has a House Price Earnings Ratio above 4.5x. The LTI can be reduced by the size of a deposit.
To highlight the housing affordability problem we have added a line to the chart above to show where a 4.5x HPER falls across each region. Tellingly only housing in the North East falls below the all-important 4.5x line. House prices in the overwhelming majority of local authorities are above 4.5x HPER and in the south of the country, all house prices are above 4.5x HPER.
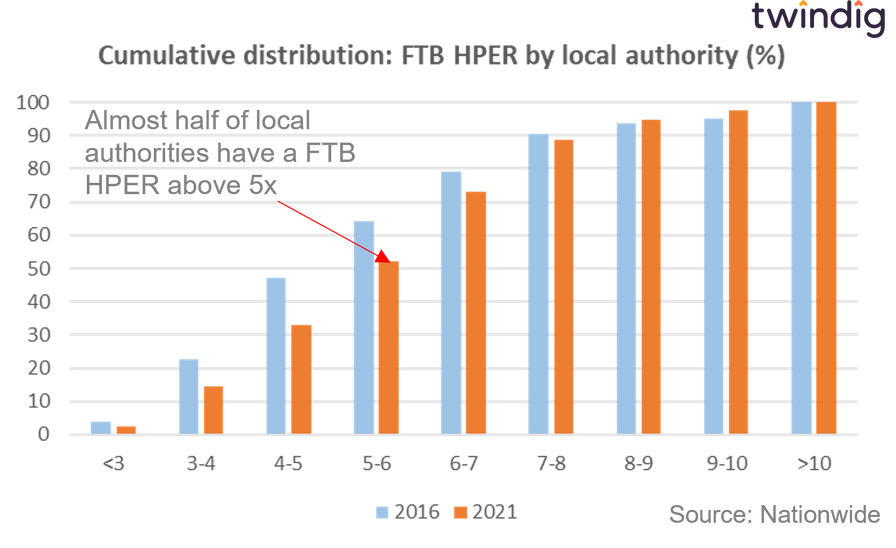
If we dig a little deeper, we can see that over time HPERs shave been shifting, house prices are rising faster than incomes as by the HPER curve shifting to the right in the graph below.
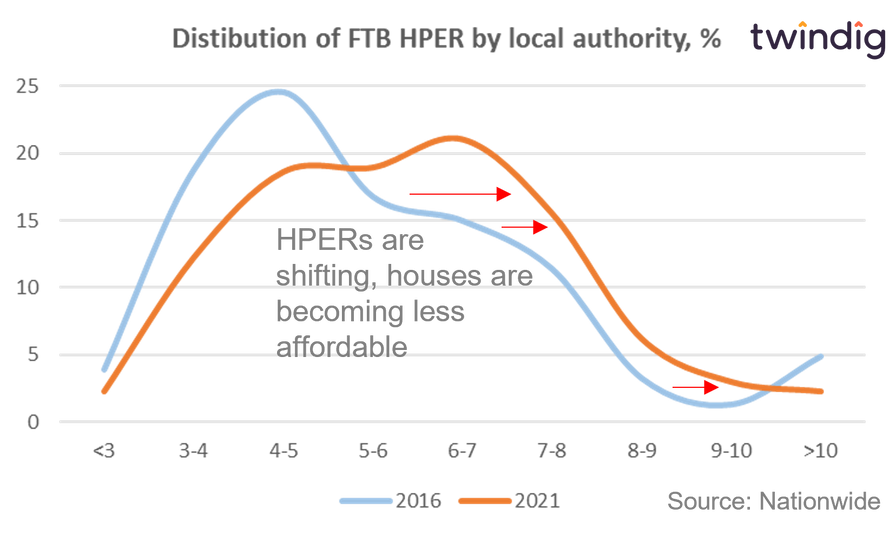
However, what is most alarming is that we are now in a position where almost half of all local authorities have a first-time buyer HPER of 5x or higher. Given lenders constraints on lending above 4.5x income, these first-time buyers are going to need a very hefty deposit to get a foot on the housing ladder.
How do we lower HPERs and LTIs?
There is good news and bad news. The good news, there are not many moving parts. The bad news, those parts are very difficult to move. House prices tend to rise faster than earnings and loan sizes are also linked to earnings (income). Every year housing affordability becomes a steeper mountain to climb, which is why we need to talk about housing affordability.
Your gonna need a bigger deposit
If we can't solve for house prices, earnings or loan size, there is only one way to fix the problem, as Roy Scheider might say 'you're gonna need a bigger deposit'
House prices
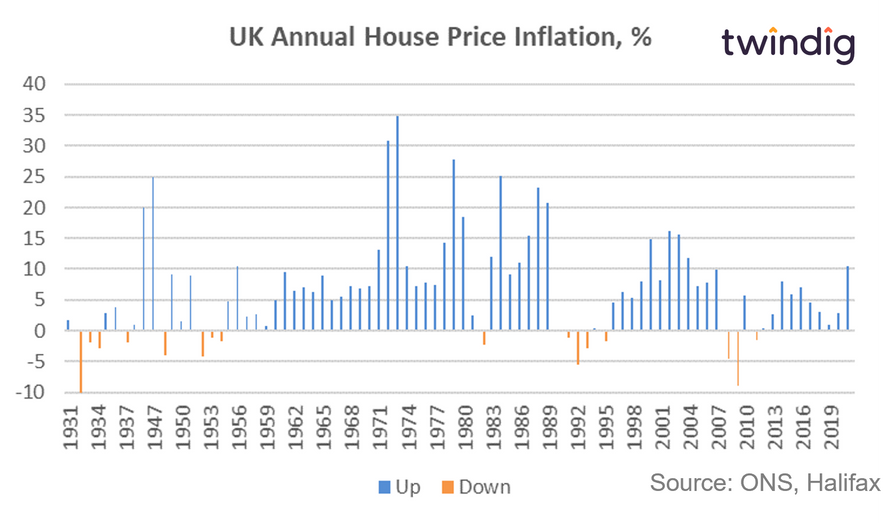
As the chart below illustrates house prices go up much more often than they go down, their robustness surprises many commentators including this one. When it comes to house prices it appears that the right strategy is to be an optimist rather than a pessimist.
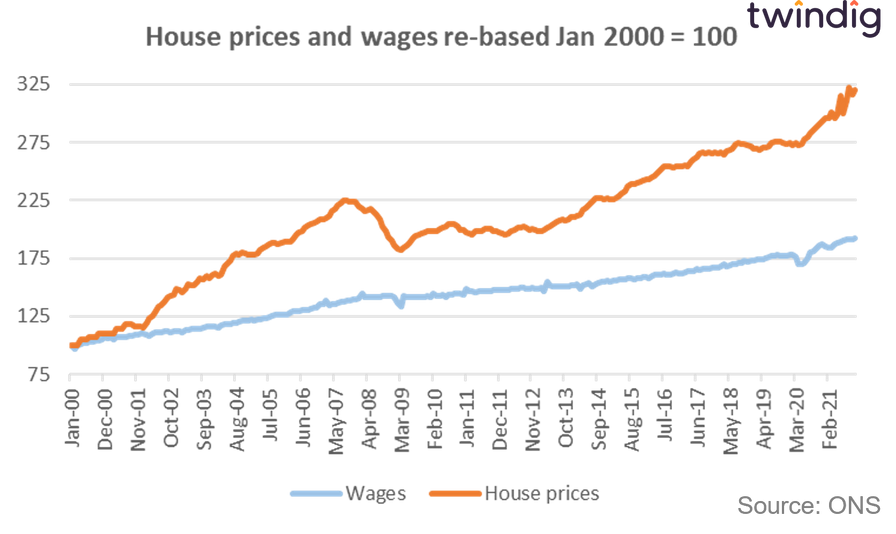
Wages, salaries, income, earnings
Call it what you like, wages, salaries, income or earnings, most people would like to be paid more money for what they do. Unfortunately, the facts speak for themselves as illustrated below. House price growth historically has outstripped wage growth, which means over time housing affordability gets worse and worse over time.
What is the House Price Earnings Ratio?
The House Price Earnings Ratio or HPER is simply the house price divided by the earnings of the home buyer. If you are buying a home costing £150,000 and your income is £50,000 you have a House Price Earnings Ratio of 3.0x.
Size of loan: the ABC of LTI and LTV
What is 'Loan to Income'?
Loan to Income or LTI is the ratio of the loan (or mortgage) your income.
If you borrow £100,000 and earn £25,000 then your LTI is 4.0 (100,000 divided by 25,000)
As we have already discussed, only 15% of loans made by a mortgage lender can have a LTI above 4.5x. The gap between the HPER and the LTI will need to be filled by a deposit.
What is 'Loan to Value'?
The loan to Value or LTV is the value of the loan or mortgage divided by the price of the home being purchased. A 95% LTV mortgage allows you to borrow up to 95% of the value of a home.
With a 95% LTV mortgage: If the home costs £100,000 you can borrow £95,000 and you need a deposit of 5%
However, if for the same £100,000 home, the mortgage LTV is 65% you can borrow £65,000 and need a deposit of £35,000.
Mortgage lenders like homebuyers to have a large deposit as it reduces their risk and the amount of money they might lose. Mortgage rates reflect this risk, you will typically find the lower the LTV the lower the mortgage rate will be
Build a bigger deposit
The size of the deposit is the final housing affordability lever. Every £1 added to a deposit reduces the size of the mortgage required. However, saving for a deposit is hard work and takes time. To reduce the LTI from 4.8x to 3.8x implies an additional deposit of one year's gross salary (salary before taxes).
Deposits, like oak trees, do not grow quickly unless you have access to other forms of finance such as The Bank of Mum and Dad.
In our view, unfortunately, the UK housing market is becoming a two-speed housing market for first-time buyers, split between those with access to the Bank of Mum and Dad and those without.
Should house prices continue to rise faster than wages housing affordability will continue to worsen and deposit requirements will continue to increase. The current reliance on The Bank of Mum and Dad means that increasingly first-time buyers' ability to buy a home is dependent on the wealth of their parents.
Can fractional ownership solve the deposit problem?
We believe it can, fractional ownership is where you are able to buy part of a home. Fractional ownership could be very helpful for a first-time buyer.
The Government's Help to Buy scheme is a form of fractional ownership, but the scheme is only available on certain new homes. The scheme has worked very well since it launched in 2013, but is due to end in 2023. We would like to see fractional ownership available to the whole market rather than just the new-build market.
You can read our case for fractional ownership here
What is housing affordability?
Housing affordability relates to the cost of buying a house compared to the housebuyers income. The lower the share of income taken up by the costs of buying a home the higher the level of affordability. It is important to consider the price or cost of the home as well as the person's income together rather than separately. What is affordable for one person may not be affordable for another: If the house costs are £400 per month and the person buying the home ears £1,000 the housing takes up 40% of their income, however, it only takes up 25% of income for someone earning £1,600 per month.
The Affordable Housing Commission suggests that when rents or purchase costs exceed a third of the household income, for those in work, the housing costs can lead to financial difficulties, arrears, debts and consequent personal problems. The position gets much worse if that percentage of income is higher. The Affordable Housing Commission says that when housing costs take 40% or more of a households income there is a very serious affordability issue.
The Bank of England reiterated their guidance on housing affordability in their December 2021 Financial Stability Report their share the view of the Affordable Housing Commission that
households with a mortgage debt-servicing ratio (debt servicing costs as a proportion of income) at or above 40% are typically much more likely to experience repayment difficulties when economic conditions become more challenging
What are the main measures of housing affordability?
House Price Earnings Ratio
The house price divided by the gross income of the home buyer. The higher the number the less affordable the home.
Debt Service Ratio
The percentage of a homebuyer's income spent on housing purchase or rental costs. As discussed above both the Bank of England and the Affordable Housing Commission believe that if housing costs are at or above 40% of income red flags are raised with respect to housing affordability.
Loan to Income Ratio
The loan to income (LTI) ratio is similar to the house price-earnings ratio, but it uses the value of the loan or mortgage rather than the house price. The Bank of England Restricts the number of high loan to income loans mortgage lenders can sell. Only 15% of all loans made on a 12-month rolling basis can have a Loan to Income above 4.5x. This is because during the Global Financial Crisis loans homeowners with LTIs above 4.5x above were more likely to experience repayment difficulties.
What is affordable housing?
Affordable housing is separate from housing affordability. Affordable housing is the term used for homes that are either sold or rented out at below-market rates or sold through a shared ownership scheme whereby the homeowner buys part of the home and pays rent on the portion they do not own.