Nationwide House Price Index
House Prices in April 2023
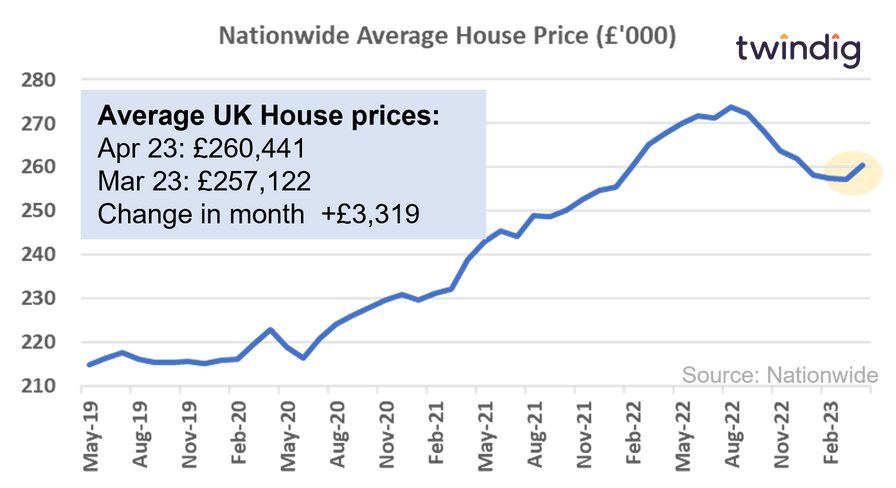
The average UK house price in April 2023 was £260,441
House prices rose by 0.5% during the last month
House prices fell by 2.7% over the last year
Nationwide House Price Index Chart
Nationwide House Price Index Commentary
House prices rose in April 2023, the first increase following seven months of consecutive falls in UK house prices, suggesting that the direction of UK house prices is no longer a one way (downward) bet.
House prices rose in April 2023, by £3,319, the Nationwide pointed to an increase in mortgage applications, improvements in consumer confidence and mortgage rates coming off their post mini-budget highs as possible reasons behind the increase in house prices during April.
The rise in house prices in April implies that house prices in the UK are more than £44,000 (or 21%) higher than they were before the start of the pandemic in 2020, which will provide some comfort to many as we enter unchartered waters, but those who bought during recent months may fear that they bought at the top of the market.
The Nationwide believes that if market conditions remain as they are they will support a modest (pedestrian) as it will take time for household finances to recover from the cost of living crisis. They believe that wage growth will be required to make up for the ravages of inflation and mortgage rates are likely to remain a headwind until the Bank of England starts to reduce Bank Rate once the battle against inflation has been won.
How much is my house worth?
If you would like to quickly see how much your house is worth you can do so by visiting twindig.com we have details of every house across the country, all 28 million, not just the one million or so that are currently for sale or rent.
Nationwide House Price Index methodology
The Nationwide house price index is calculated from owner-occupier house purchase transactions which are in part-financed by a mortgage. Buy to let and cash purchases are not included in the Nationwide House Price Index.
The monthly house price measures the mix adjusted house price for houses across the UK.
The Nationwide uses a statistical process called hedonic statistical regression to calculate the average UK house price.
The nationwide takes into account the following factors when calculating its house price index:
UK location - which part of the country the house is located
Size of property - the physical size of the property, larger houses usually a command a higher price
Number of bedrooms - once again a higher number of bedrooms normally implies a higher price. The Nationwide looks at five types 1 bedroom, 2 bedrooms, 3 bedrooms, 4 bedrooms and more than 4 bedrooms.
Property type: The Nationwide house price index considers several different house types: detached homes, semi-detached homes, terraced houses, flats and apartments.
Neighbourhood characteristics: The Nationwide classifies homes as being included in one of 59 different neighbourhood categories (such as retirement neighbourhoods or council /social housing neighbourhoods)
The index is 'mix-adjusted' so that changes in the number of different sized properties sold each month doesn't impact the average house price. For instance, if one month more 4 bedroom detached houses were sold than normal this may increase the reported average house price necessarily.
The Nationwide house price index is based on the mortgages it approves itself. The Nationwide is the UK's second-largest mortgage lender with a market share of around 15%.
Seasonal adjustments. The Nationwide believes that house prices are slightly seasonal, house prices are typically higher in spring and summer months. This ebb and flow of demand can impact house prices by up to +/-1.5%. The Nationwide House Price Index adjusts for its view of seasonal factors
History of the Nationwide House Price Index
The Nationwide House Price index has been running on an annual basis since 1952, a quarterly basis since 1974 and from 1991 on a monthly basis. This makes it the longest-running private house price index in the UK and the second longest-running monthly house price index (after the monthly Halifax house price index which has been running since 1983.
Alongside its monthly house price index, the Nationwide publishes a more detailed index each quarter including 13 regional house price indices by buyer type (first-time buyers and former owner-occupiers). The Nationwide also publishes UK house price estimates based on four different property types: detached houses, semi-detached houses, terraced houses and flats and apartments.
The final set of house price indices produced by the Nationwide Building Society relate to new and existing homes.
In total the Nationwide produces 48 different house price indices on a quarterly basis.