Scotland's house price winners and losers
The latest data from the Land Registry reveals that the average house price in Scotland is currently £192,500.
On average house prices Scotland increased by 3.0% or £5,610 over the last month.
Over the last year (last 12 calendar months) average house prices in Scotland increased by 3.2% or £5,970.
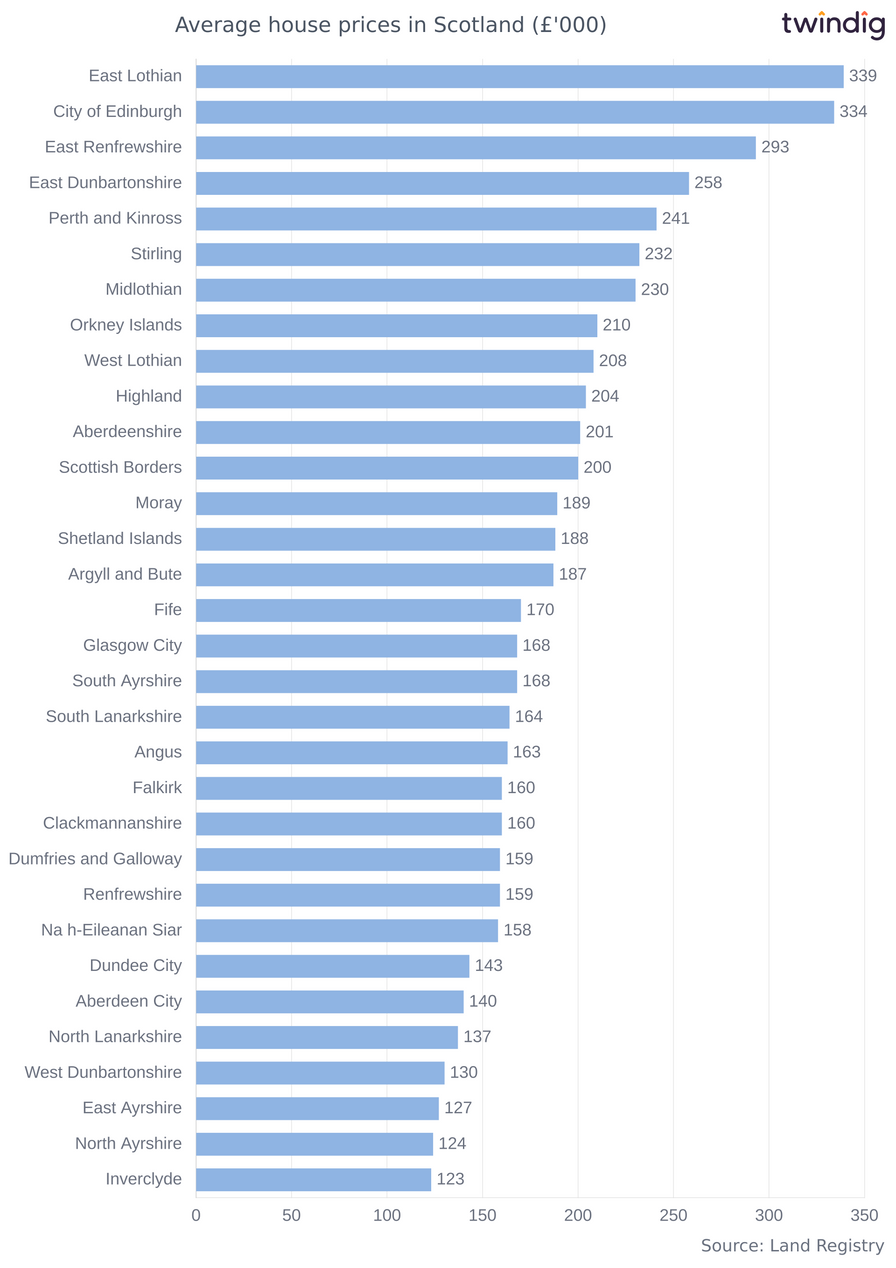
However, across Scotland, there is a significant spread of house prices at the Local Authority level ranging from £122,800 in Inverclyde to £338,900 in East Lothian.
Scotland average house prices by local authority
We show in the graph below the average house prices for every local authority across Scotland.
The three most expensive areas for house prices in Scotland are:
East Lothian where average house prices are £338,900
City of Edinburgh, where average house prices are £334,100, and
East Renfrewshire where average house prices are £293,100
The three least expensive areas for house prices in Scotland are:
Inverclyde where average house prices are £122,800
North Ayrshire with average house prices of £124,000, and
East Ayrshire where average house prices are £127,500
Scotland house price winners and losers last month
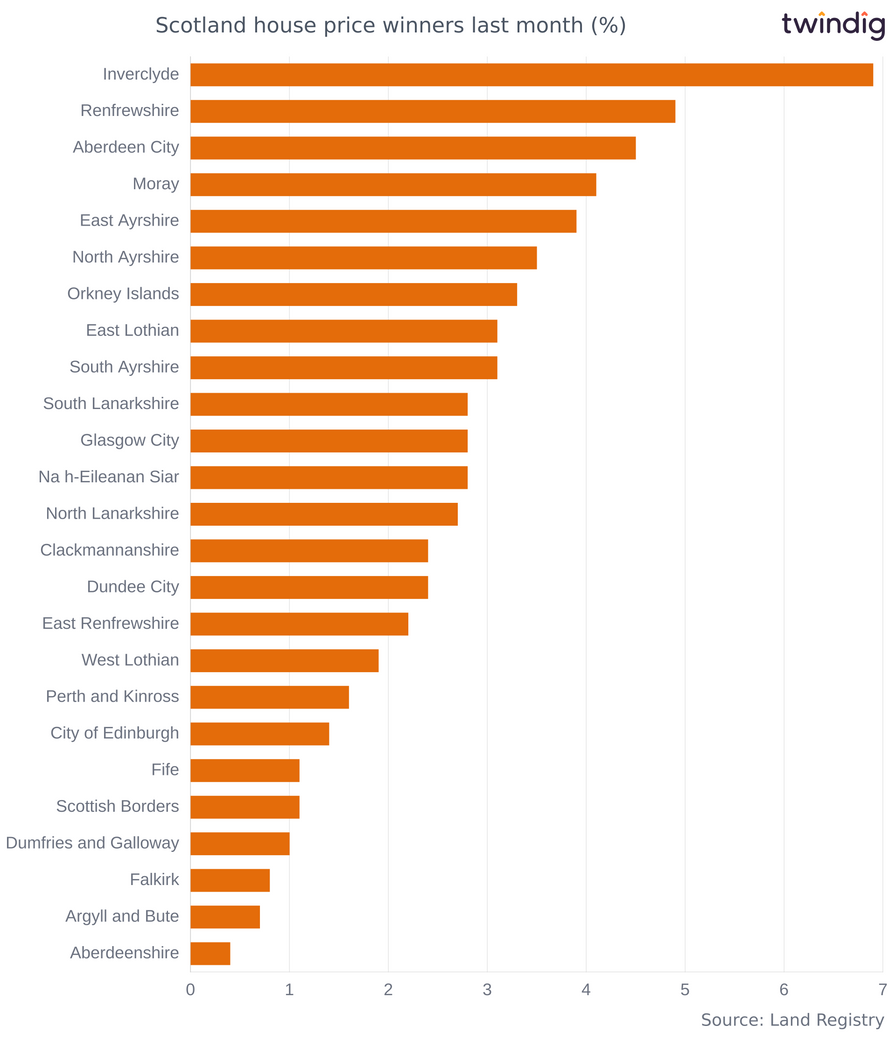
Over the last month house prices in Scotland increased the most in percentage terms in:
Inverclyde where average house price increased by 6.9%,
Renfrewshire where average house prices rose by 4.9%,
Aberdeen City where average house prices were up by 4.5%
Are you lucky enough to live in one of the hottest housing markets in Scotland?
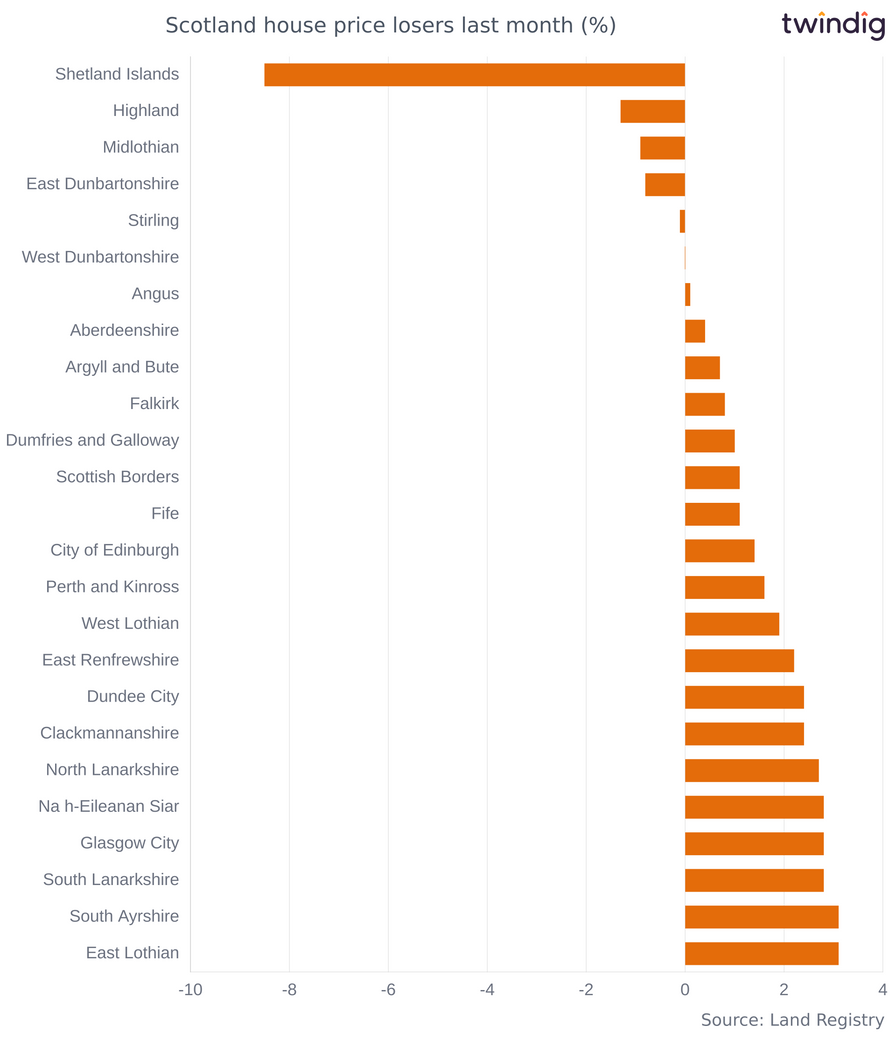
House prices in Scotland fell the most in percentage terms last month in:
Shetland Islands where average house prices dropped by 8.5%,
Highland where average house prices fell by 1.3%,
Midlothian where average house prices were down 0.9%
We show the percentage changes in house prices for each local authority across Scotland in the chart below:
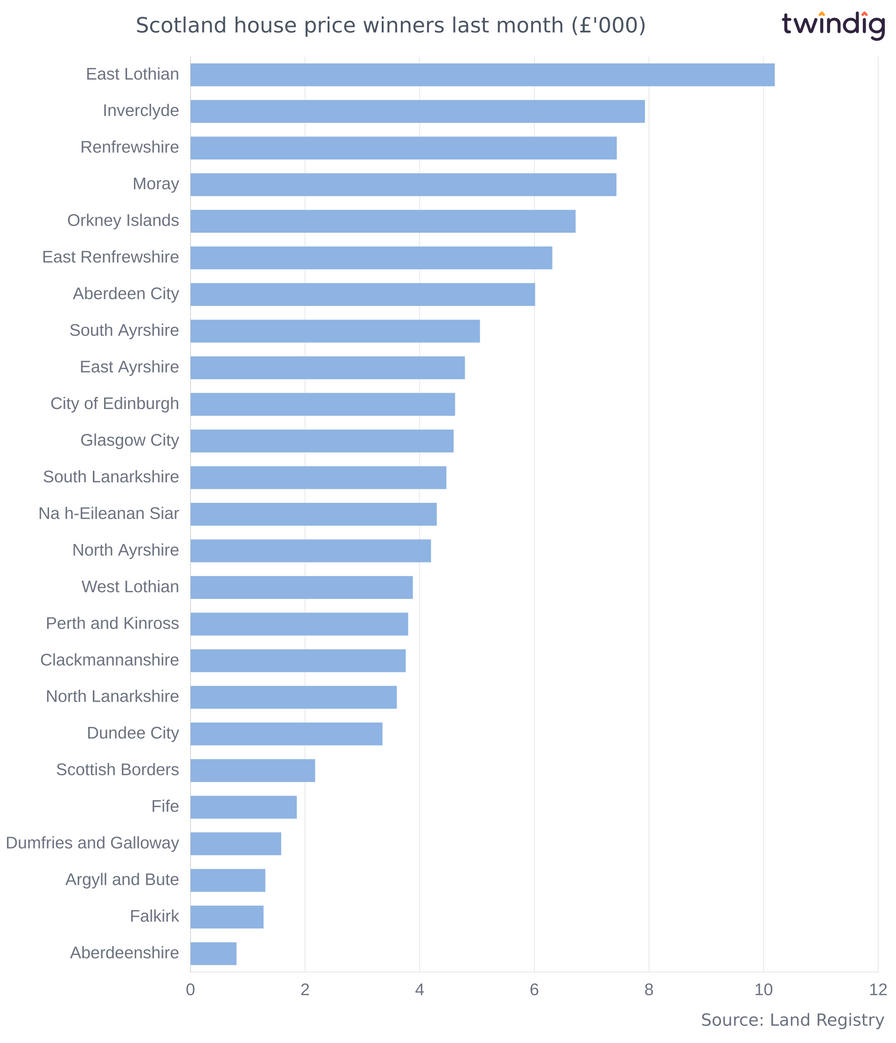
The biggest absolute (monetary) increases in house prices in Scotland last month were in:
East Lothian where house prices climbed by £10,190,
Inverclyde where house prices increased by £7,930,
Renfrewshire where house prices rose by £7,430
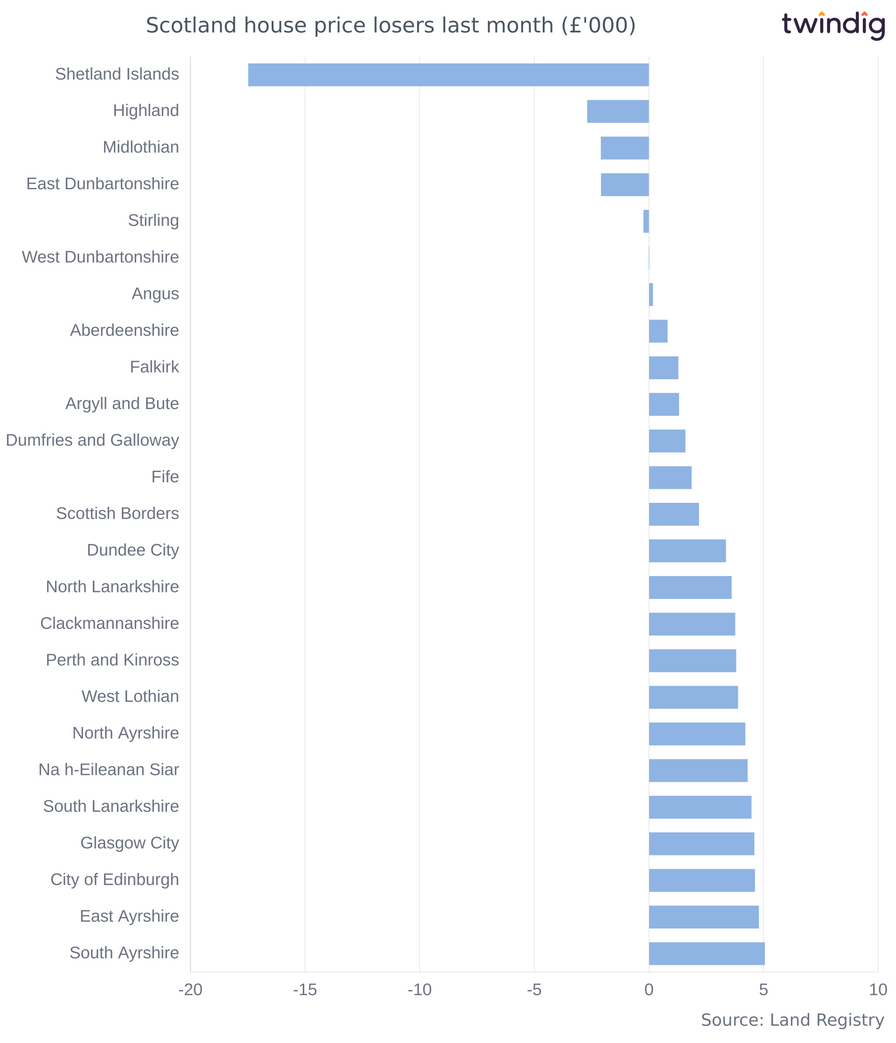
At the other end of the Scotland house price league, house prices fell most in:
Shetland Islands which saw house price fall, on average, by £17,470,
Highland where average house prices fell by £2,690,
Midlothian where house prices were down £2,090
We show the monetary change in average house prices across each Local Authority across Scotland in the chart below.
Scotland house price winners and losers last year
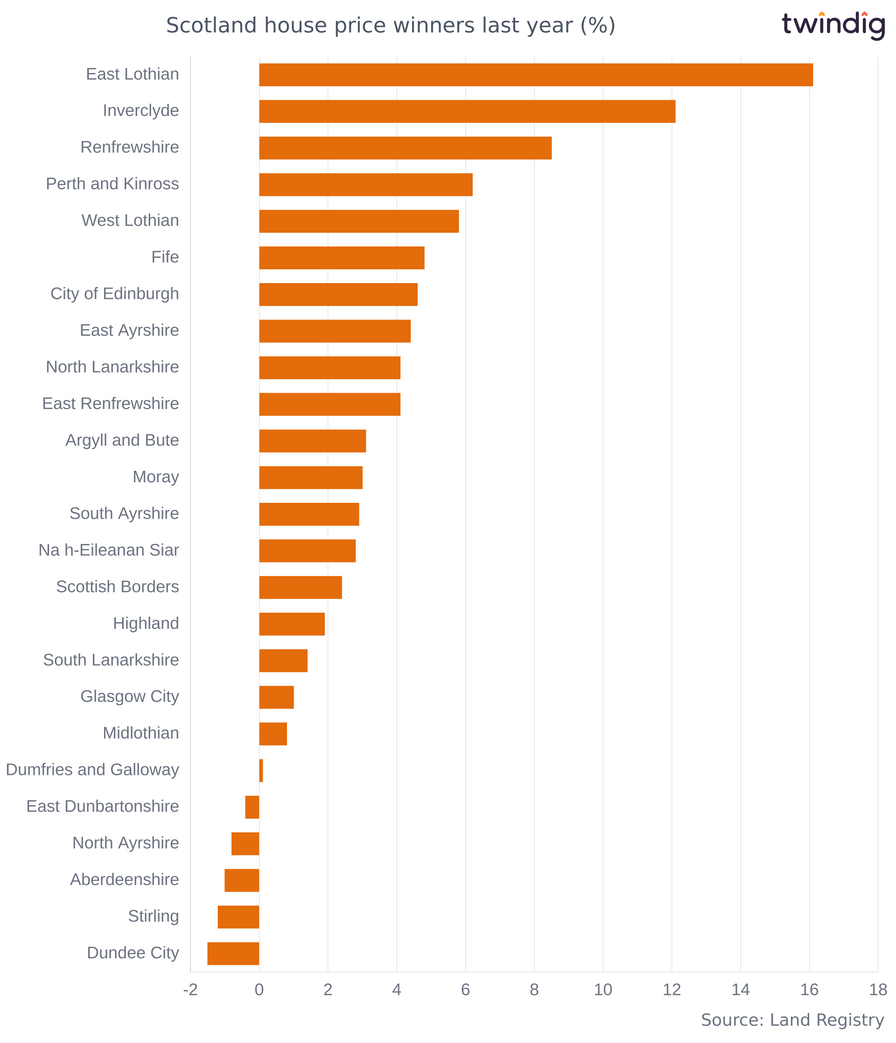
Scotland witnessed strong house price growth over the last twelve months, on average across Scotland house prices have increased by 3.2%
The biggest house price winners in percentage terms in Scotland are listed below:
East Lothian with average house prices up 16.1%,
Inverclyde, which has seen house prices increase by 12.1% over the last twelve months, and
Renfrewshire where house prices have risen, on average, by 8.5%
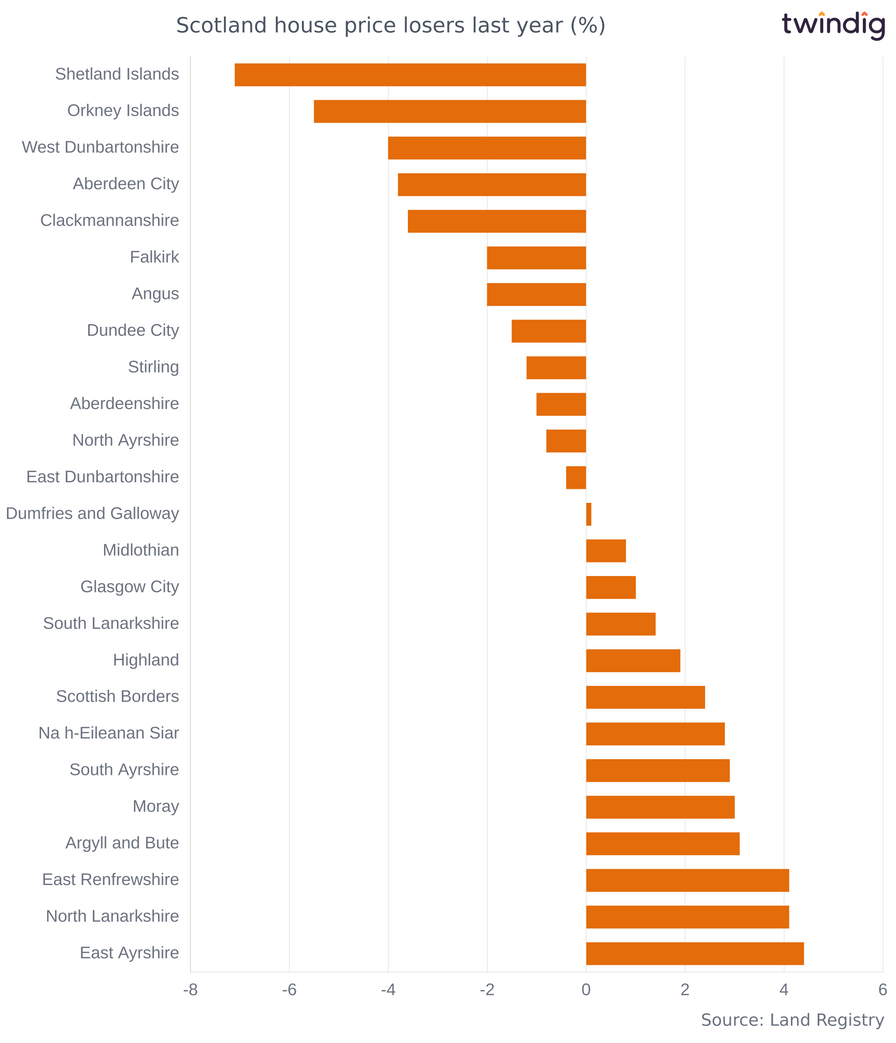
At the bottom end of the annual house price table are:
Shetland Islands where house prices have fallen by 7.1%,
Orkney Islands, with average house price deflation of 5.5%, and
West Dunbartonshire with house price deflation at 4.0%
We show the percentage change in house prices over the last twelve months across every Local Authority in the Scotland in the chart below
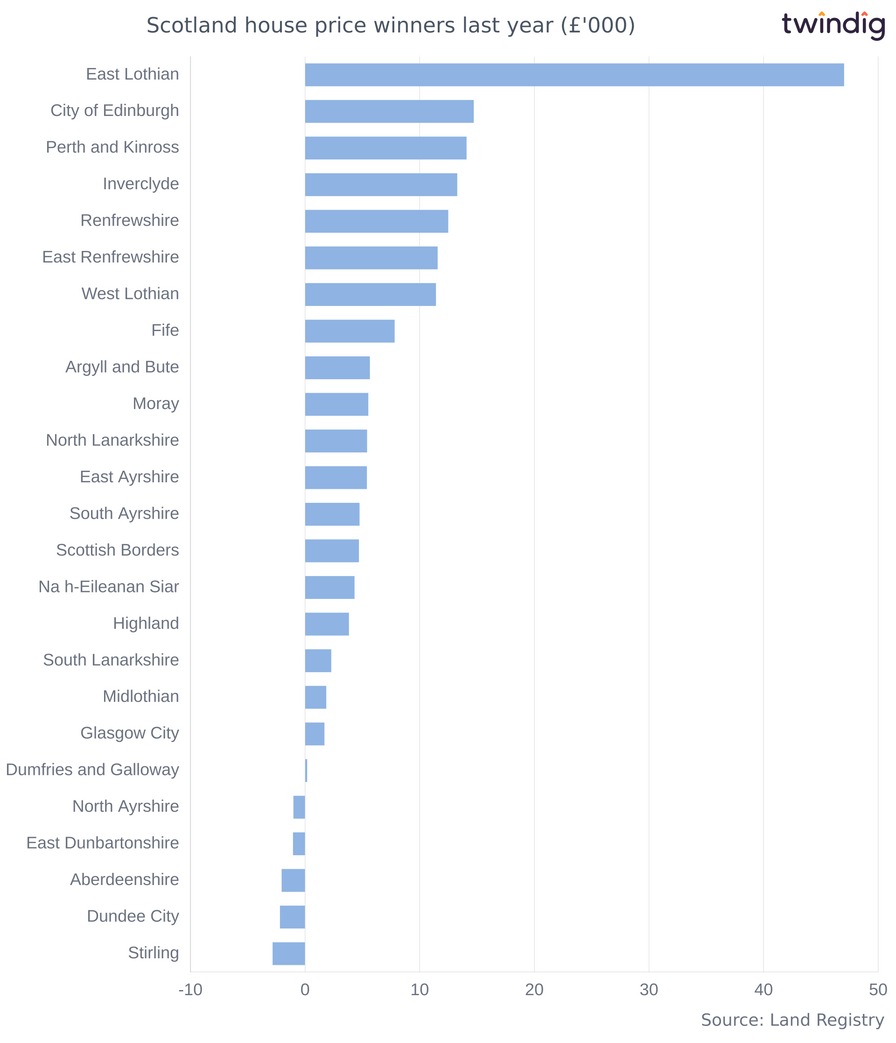
Finally turning to the monetary or cash changes to house prices in Scotland over the last year, the biggest house price winners in absolute terms were:
East Lothian which has seen house prices increase by £47,000,
City of Edinburgh with house prices gains of £14,690,
Perth and Kinross where house prices have risen, on average, by £14,070
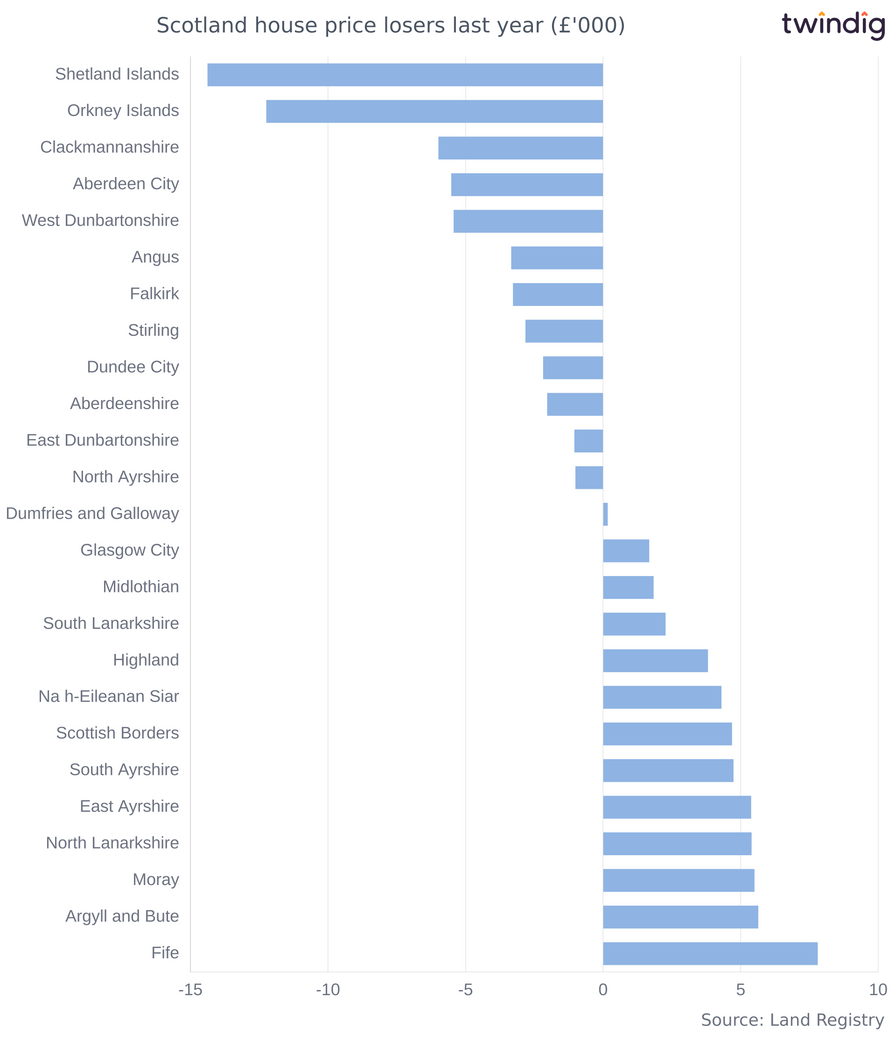
House prices increased in monetary terms across every local authority across Scotland last year, but those areas that saw the smallest increase in average house prices were:
Shetland Islands where average house prices were down £14,370,
Orkney Islands, which saw average house prices fall by £12,240, and
Clackmannanshire where house prices decreased by £5,980