House price winners and losers North West
The latest data from the Land Registry reveals that the average house price in the North West is currently £211,800.
On average house prices in the North West decreased by 0.2% or £420 over the last month.
Over the last year (last 12 calendar months) average house prices in the North West increased by 2.7% or £5,570.
However, across the North West, there is a significant spread of house prices at the Local Authority level ranging from £110,700 in Burnley to £359,600 in Trafford.
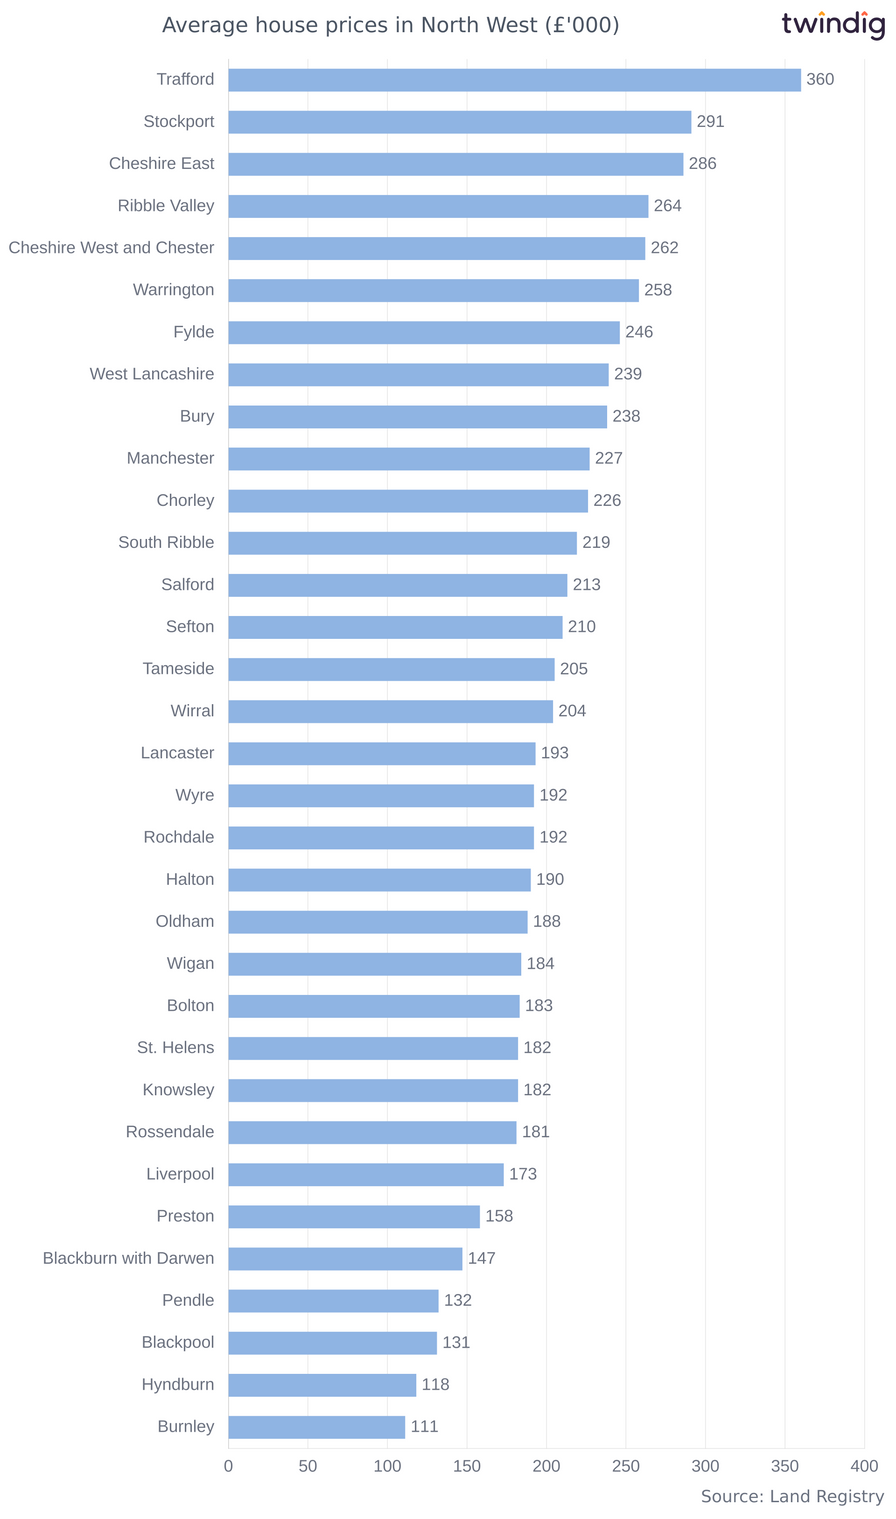
North West average house prices by local authority
We show in the graph below the average house prices for every local authority across the North West.
The three most expensive areas for house prices in the North West are:
Trafford where average house prices are £359,600
Stockport, where the average house costs £290,700, and
Cheshire East where you can buy the average home for £286,400
The three least expensive areas for house prices in the North West are:
Burnley where you can snap up the average home for £110,700
Hyndburn with average house prices of £118,000, and
Blackpool where the average house will set you back £131,400
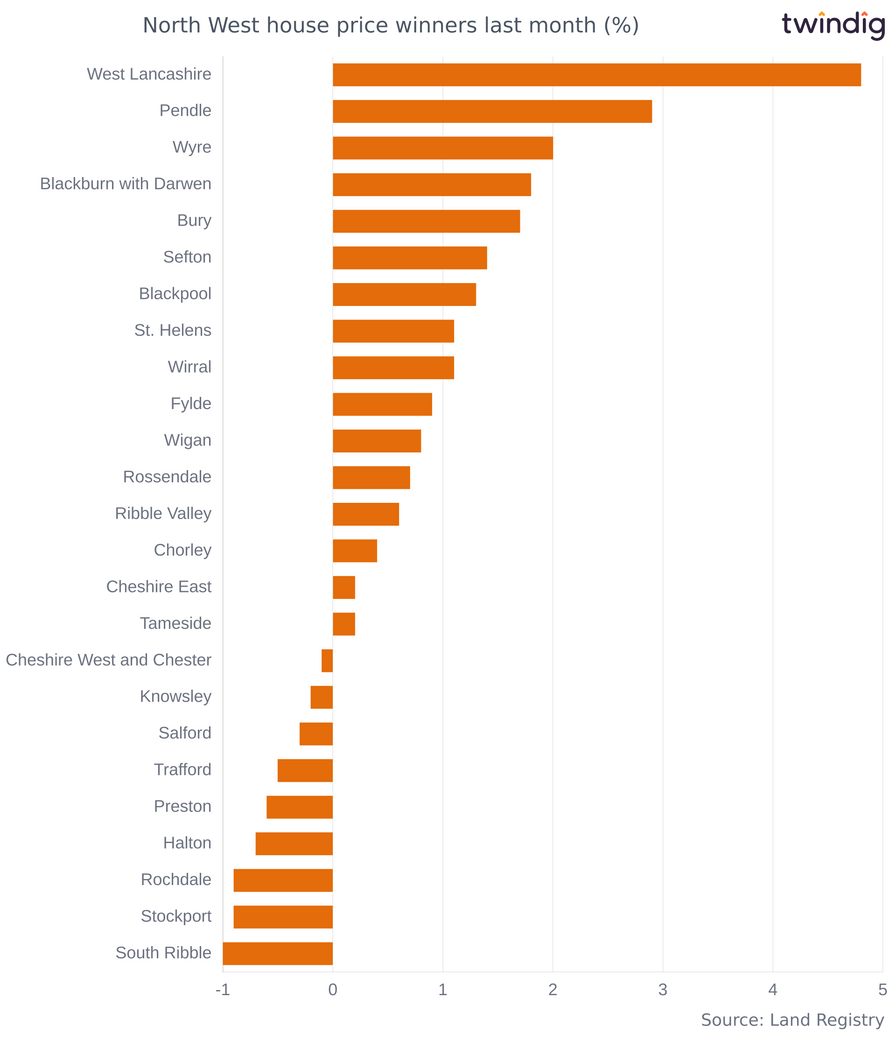
North West house price winners last month (percentage)
Across the North West decreased by 0.2% over the last month, however, within the North West not all house prices decreased by the same amount:
Over the last month house prices in the North West increased the most in percentage terms in:
West Lancashire where average house prices increased by 4.8%,
Pendle where average house prices rose by 2.9%,
Wyre where average house prices were up by 2.0%
The chart below shows the hottest 25 housing markets across the North West where house prices increased the most in percentage terms over the last month. Do you live in one of the hottest housing markets in the North West?
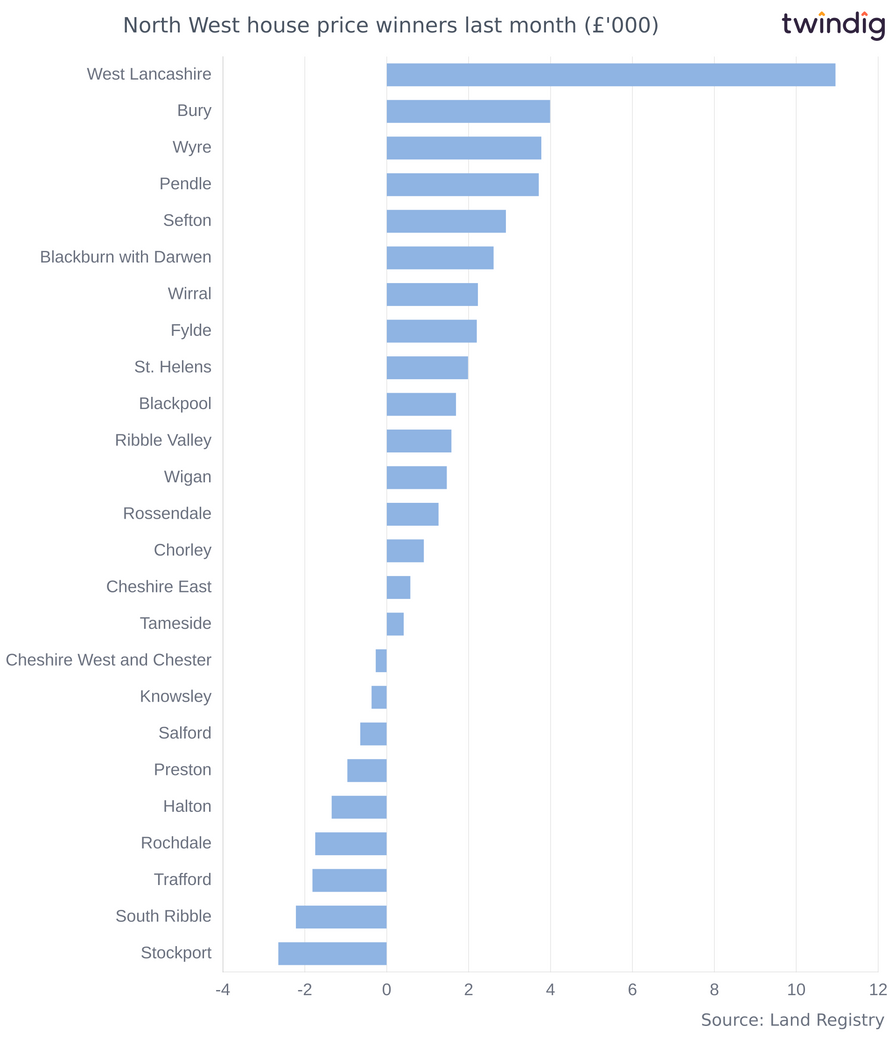
North West absolute house price winners last month
When we look at the absolute (monetary) house price rises across the North West last month, we saw the biggest house price increases in:
West Lancashire where house prices climbed by £10,950,
Bury where house prices increased by £3,980,
Wyre where house prices rose by £3,770
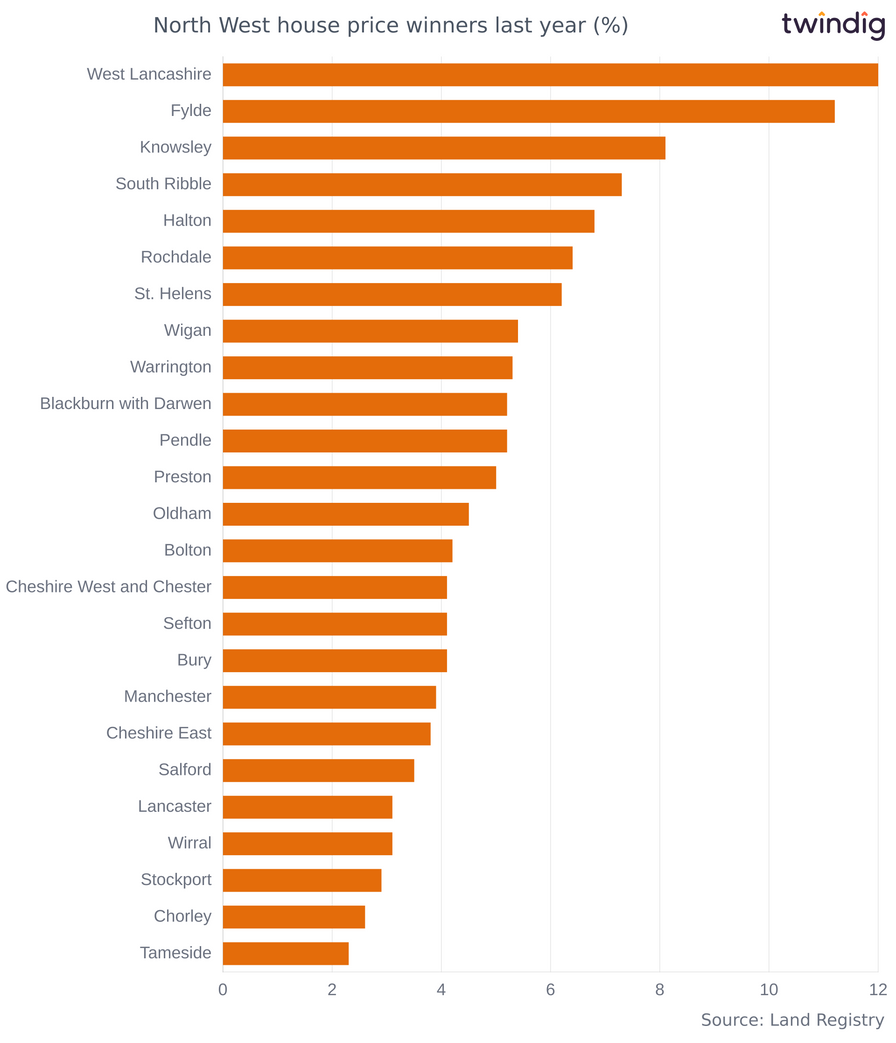
North West relative house price winners last 12 months
House prices have increased significantly over the last 12 months in many areas of the North West. On average across the North West house prices have increased by 2.7%
The biggest house price winners in percentage terms across the North West over the last year are listed below:
West Lancashire with average house prices up 12.0%,
Fylde, which has seen house prices increase by 11.2% over the last twelve months, and
Knowsley where house prices have risen, on average, by 8.1%
We show the top 25 housing markets, where house prices have increased the most on a relative (percentage) basis across the North West in the chart below:
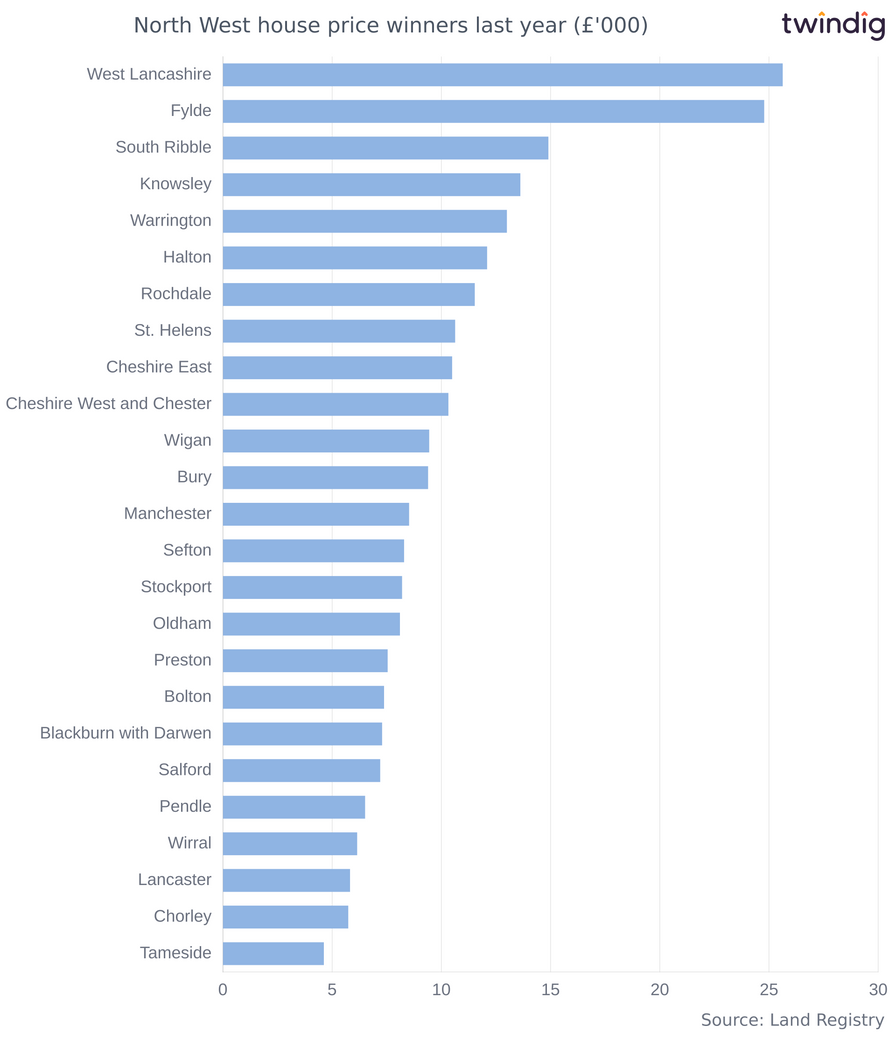
North West absolute house price winners last 12 months
Turning to the absolute or monetary increases in house prices across the North West over the last 12 months, on average house prices increased by £5,570. We show the areas where house prices increased the most in the North West below
West Lancashire which has seen house prices increase by £25,620,
Fylde with house prices gains of £24,770,
South Ribble where house prices have risen, on average, by £14,890
We show the North West's top 25 housing markets in terms of absolute house price increases over the last 12 months in the chart below.
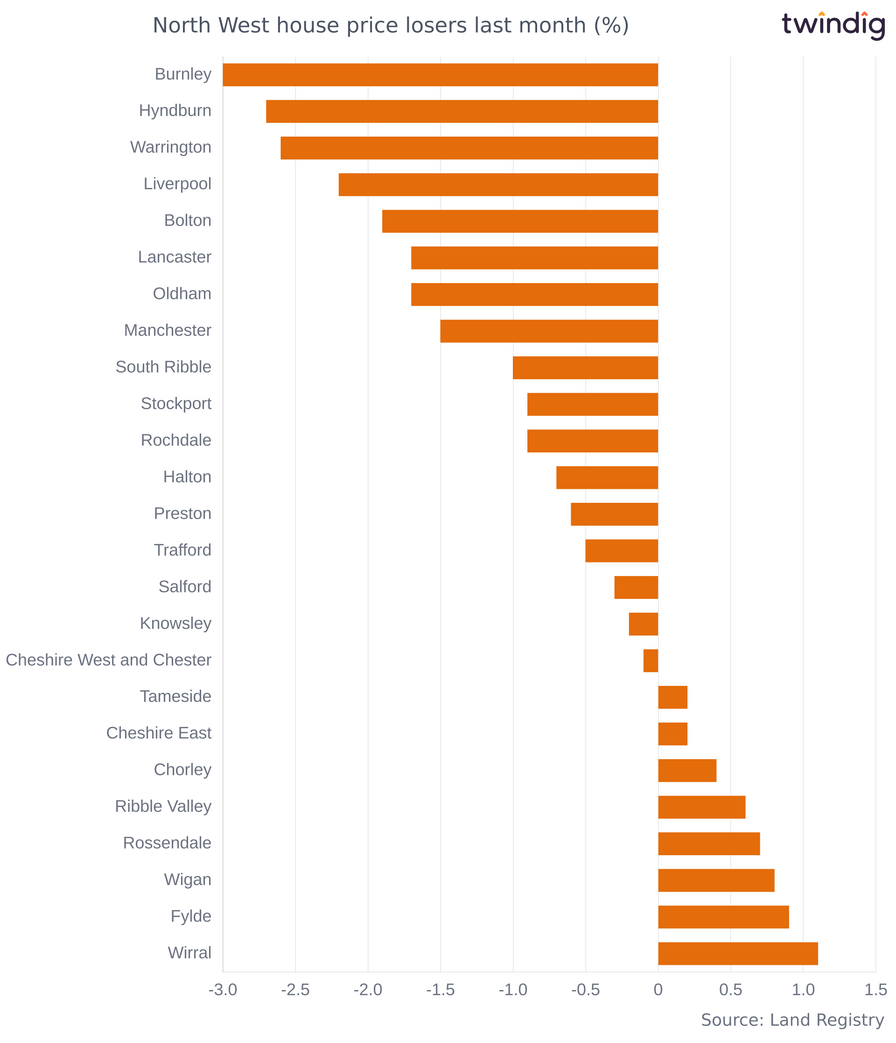
North West relative house price losers last month
Unfortunately, house prices did not rise in every area of the North West last month. The biggest relative house prices losers last month were:
Burnley where average house prices dropped by 3.0%,
Hyndburn where average house prices fell by 2.7%,
Warrington where average house prices were down 2.6%
We show the percentage changes in house prices for each local authority across North West in the chart below
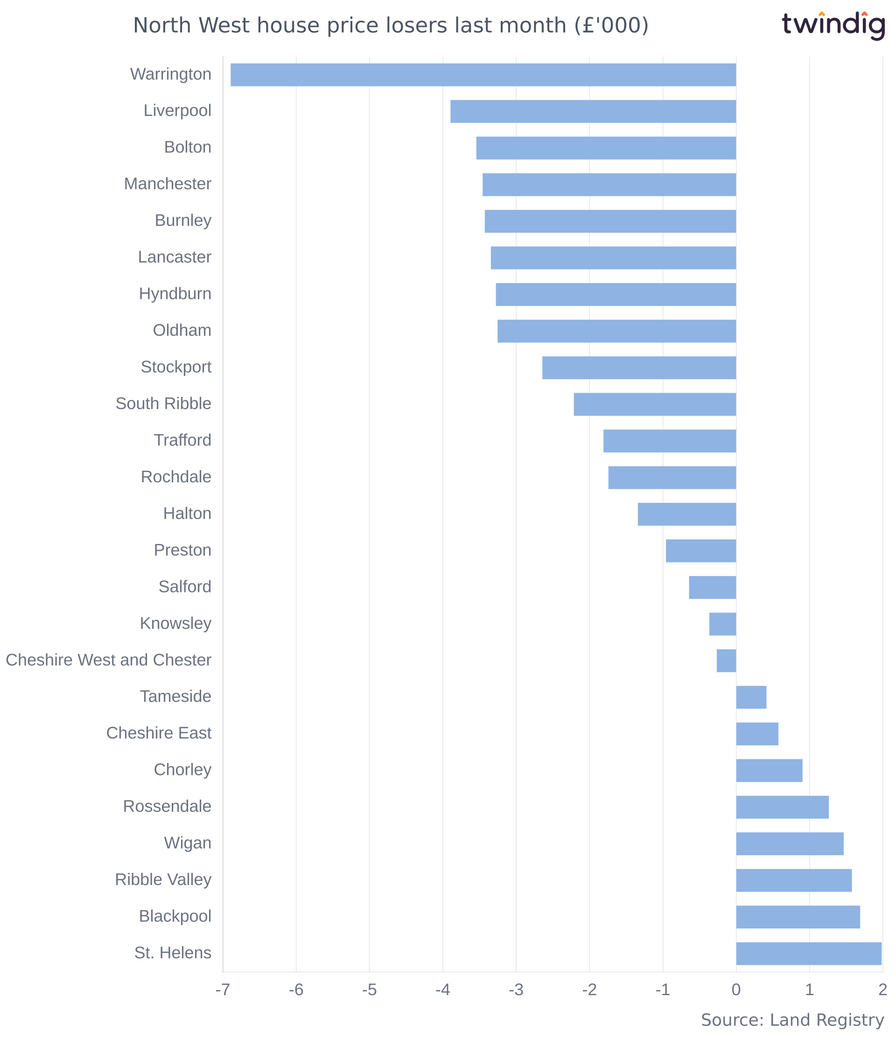
North West absolute (monetary) house prices losers last month
In monetary terms, house prices in the North West fell or increased the least in:
Warrington which saw house price fall, on average, by £6,890,
Liverpool where average house prices fell by £3,890,
Bolton where house prices were down £3,540
We show the monetary change in average house prices across each Local Authority across North West in the chart below:
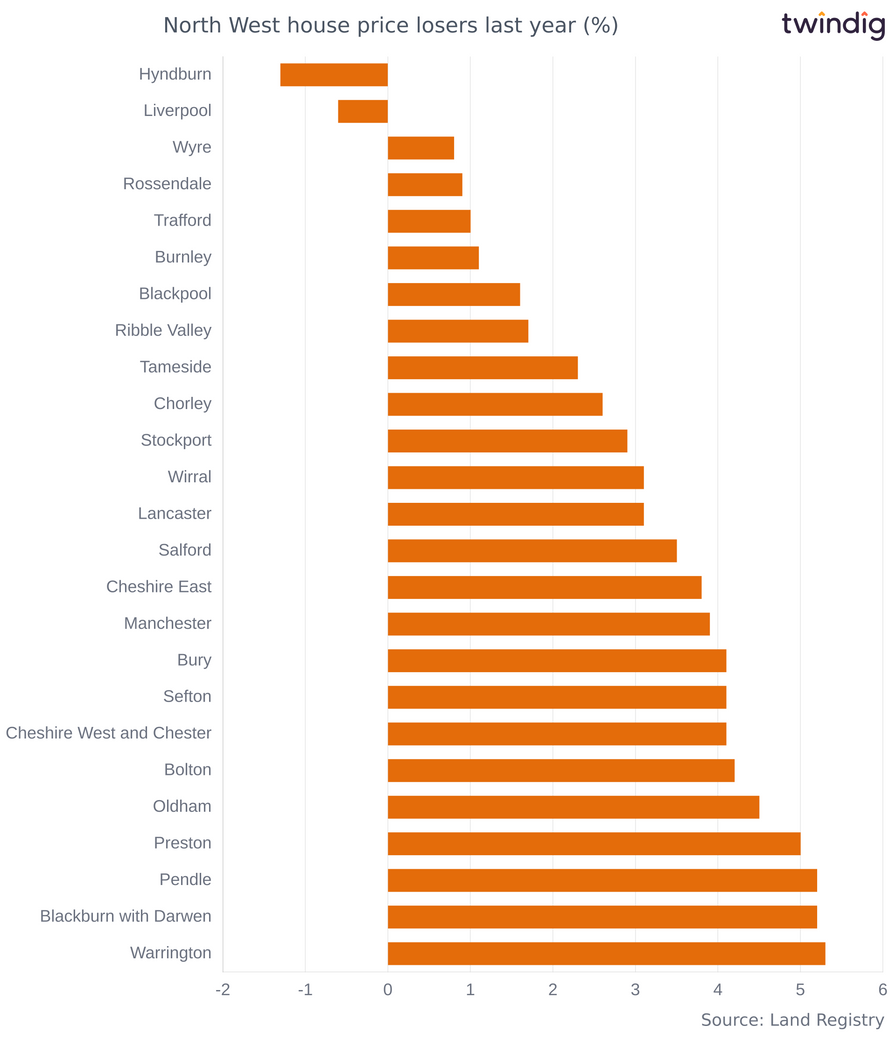
North West relative house price losers last year
Whilst the average house prices in the North West increased by 2.7% over the last twelve months, not all areas of the North West performed as well.
At the bottom end of the North West's annual house price table are:
Hyndburn where house prices have fallen by 1.3%,
Liverpool, with average house price deflation of 0.6%, and
Wyre with house price inflation at 0.8%
We show the percentage change in house prices over the last twelve months across every Local Authority in the North West in the chart below
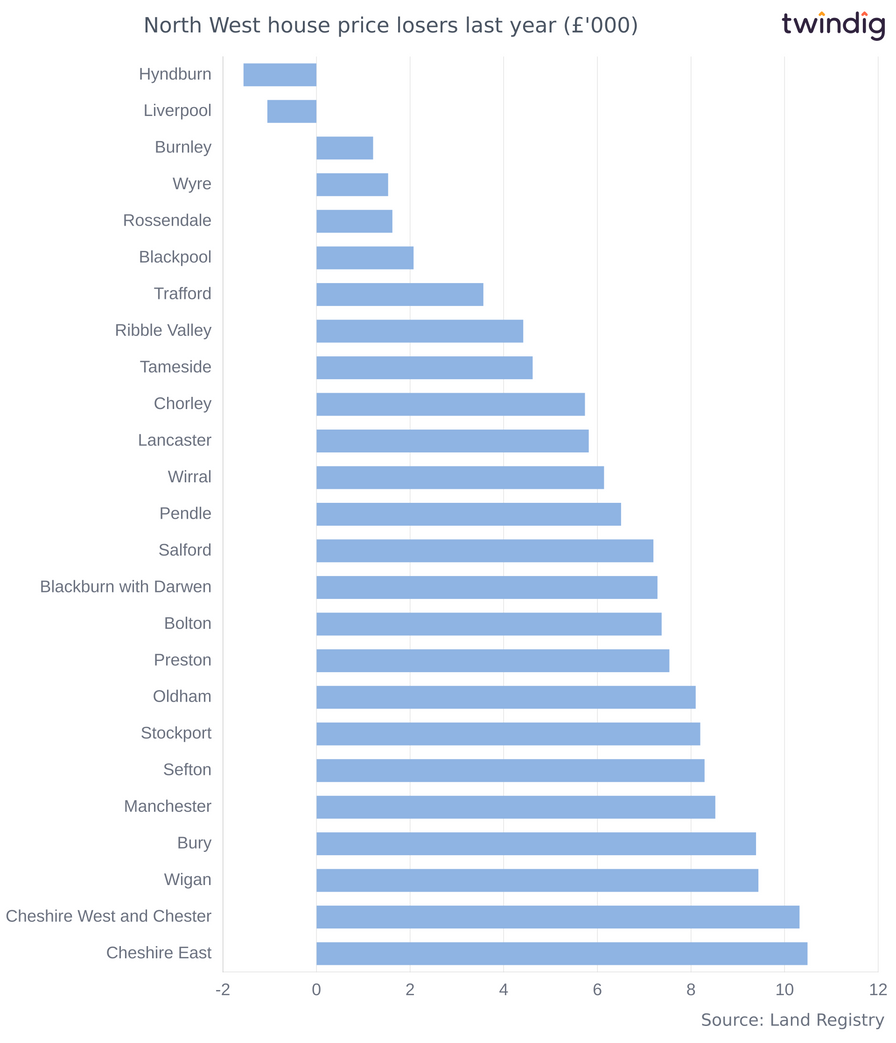
North West absolute house prices losers last 12 months
Finally turning to the monetary or cash changes to house prices in the North West over the last year. Average house prices across the North West increased by £5,570, but not all areas of the North West performed as well. The areas which saw the worst house price performance in the North West over the last year were:
Hyndburn which has seen house prices down by £1,550,
Liverpool with house prices fall of £1,040,
Burnley where house prices have increased, on average, by £1,200
We show in the chart below the areas of the North West with the worst absolute house price performance over the last 12 months.