Mortgage approvals
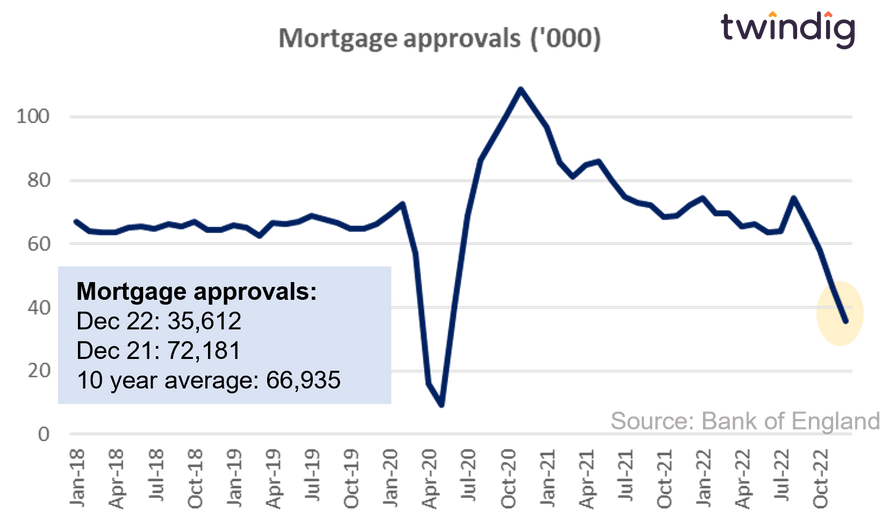
UK Mortgage approvals are the key leading housing market indicator, in our view. A mortgage approval today typically leads to a housing transition in three months' time. Mortgage approvals plummeted in December 2022.
Latest UK Mortgage approvals
Key UK mortgage approval statistics and figures:
- December 2022: 35,612
- Down 22.9% on November 2022
- Down 50.7% on December 2021
- 5 year average 68,200
- 10 year average 66,940
- 20 year average 73,300
- Average since Oct 1986 82,890
Chart of recent UK mortgage approvals
The data for this chart can be found at the end of this article
UK mortgage approval commentary
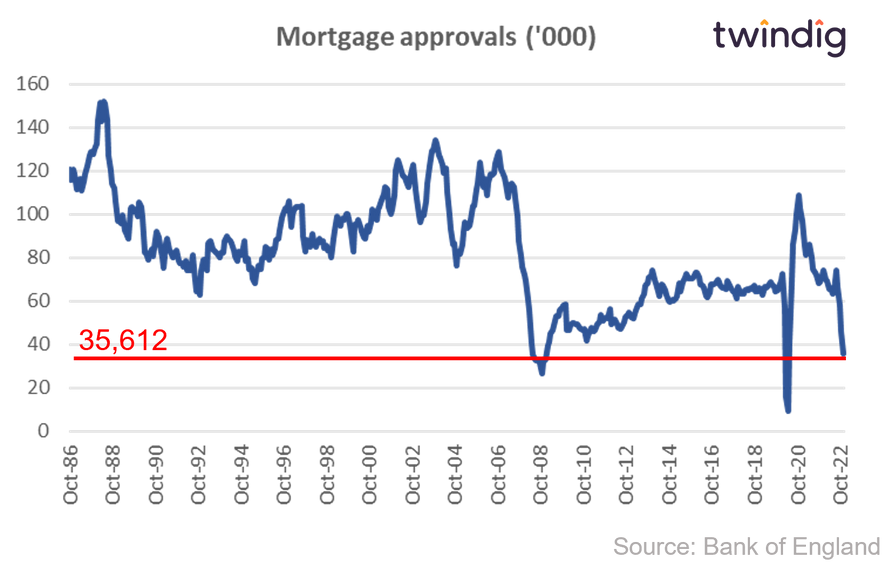
Mortgage approvals in December 2022 were 35,612, which was 22.9% down on November 2022 and 50.7% below their level a year ago (72,181), and 47% below their ten-year average of 66,940. The drop in mortgage approvals in December 2022 was significant, the largest fall since first COVID-19 pandemic lockdown taking mortgage approvals to their lowest level since May 2020. The housing market gave a big thumbs down to the September mini-budget and hundreds if not thousands of mortgage products were pulled from the shelves and quoted mortgage rates rose significantly as lenders reacted to the mini-budget. Whilst most of the proposals of the mini-budget have been reversed and the financial markets have welcomed the u-turns and, the mortgage market is yet to return to normal. The new Prime Minister and new Chancellor may have settled and stabilised the financial markets, but the challenges of cost of living increases and mortgage rate rises have hamstrung the housing market as we enter into 2023.
Chart of long term UK Mortgage approvals
Credit Conditions Survey
The latest Bank of England Credit Conditions survey (19 Jan 23) reported that lenders expect the supply of mortgages to reduce during the next three months and mortgage rates to rise. The demand for mortgages from homebuyers is expected to fall, but demand for re-mortgaging to rise over the next three months. Mortgage supply was reduced in Q4 2022 for the fourth quarter in a row and is expected to fall again in the coming three months. The reduction in Q4 2022 may be bigger than the Credit Conditions Survey anticipates because the survey was conducted before the UK Government's mini-budget on 23 September. If the survey was conducted today, we expect that lenders' expectations for credit conditions in the coming months would be much lower than they were ahead of the budget. The Bank of England's bi-annual Financial Stability Report in July reported that in response to changes in the economic environment, banks are adjusting mortgage affordability tests to account for recent and expected increases in inflation and interest rates. And in the consumer credit market, intelligence suggests that given the considerable uncertainty in the economic outlook, banks are looking to target new lending towards borrowers with higher credit scores. We often say that the mortgage approvals data is the key lead indicator for the UK housing market and we will be watching the mortgage approval data with eagle eyes to see if they indicate any problems ahead.
Future publication dates for UK Mortgage approvals
- January 2023 Data - 1 March 2023
- February 2023 Data - 29 March 2023
- March 2023 Data - 4 May 2023
- April 2023 Data - 31 May 2023
- May 2023 Data - 29 June 2023
UK Mortgage approval data since January 2018
| Date | Mortgage Approvals ('000) |
| Jan 18 | 66.9 |
| Feb 18 | 64.0 |
| Mar 18 | 63.6 |
| Apr 18 | 63.6 |
| May 18 | 65.0 |
| Jun 18 | 65.6 |
| Jul 18 | 64.9 |
| Aug 18 | 66.2 |
| Sep 18 | 65.6 |
| Oct 18 | 67.1 |
| Nov 18 | 64.5 |
| Dec 18 | 64.3 |
| Jan 19 | 65.9 |
| Feb 19 | 65.3 |
| Mar 19 | 62.6 |
| Apr 19 | 66.7 |
| May 19 | 66.1 |
| Jun 19 | 67.1 |
| Jul 19 | 68.7 |
| Aug 19 | 67.6 |
| Sep 19 | 66.6 |
| Oct 19 | 64.7 |
| Nov 19 | 64.8 |
| Dec 19 | 66.4 |
| Jan 20 | 69.1 |
| Feb 20 | 72.5 |
| Mar 20 | 57.0 |
| Apr 20 | 15.8 |
| May 20 | 9.3 |
| Jun 20 | 40.7 |
| Jul 20 | 68.9 |
| Aug 20 | 86.3 |
| Sep 20 | 93.4 |
| Oct 20 | 100.9 |
| Nov 20 | 107.5 |
| Dec 20 | 102.9 |
| Jan 21 | 96.8 |
| Feb 21 | 85.7 |
| Mar 21 | 81.1 |
| Apr 21 | 84.8 |
| May 21 | 85.9 |
| June 21 | 79.9 |
| July 21 | 74.5 |
| August 21 | 73.1 |
| September 21 | 72.0 |
| October 21 | 68.5 |
| November 21 | 69.0 |
| December 21 | 72.3 |
| January 22 | 74.4 |
| February 22 | 69.8 |
| March 22 | 69.5 |
| April 22 | 65.5 |
| May 22 | 66.1 |
| June 22 | 63.5 |
| July 22 | 64.2 |
| Aug 22 | 74.4 |
| Sep 22 | 66.8 |
| Oct 22 | 57.9 |
| Nov 22 | 46.1 |
Source: Bank of England
Bank of England Statistical Tables