Stamp Duty Holidays

This article looks at the impact of the COVID Stamp Duty Holiday on housing transactions and house prices and what happened to housing transactions and house prices during previous Stamp Duty Holidays.
Stamp Duty Holidays and Housing Transactions
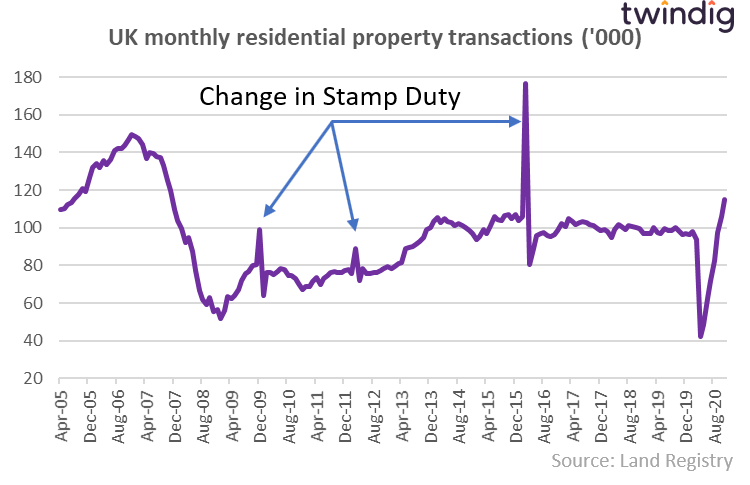
Before the COVID pandemic there had been three Stamp Duty Holidays. You might not be able to remember when they were but look at the graph below we are sure that you will be able to tell when they came to an end. Technically the third one wasn’t a Stamp Duty Holiday, but it signalled the start date of the additional stamp duty charge on additional homes (holiday homes, holiday lets, buy to lets etc)
Thinking of buying? Then use our Stamp Duty Calculator
You can use our stamp duty calculator to work out how much Stamp Duty you will need to pay. Amounts vary depending on where the property is: England, Scotland, Wales or Northern Ireland, whether or not you are a first time buyer and if you are purchasing you main home or an additional property such as a holiday home, a holiday let or a buy to let property. Our Stamp Duty Calculator takes all of these factors into account
Three stamp duty changes but only one result
All the previous changes in Stamp duty have led to the same result, a rush of transactions in the month before the change followed by a big fall immediately after a lull in housing transactions for a few months after. Following the introduction of the higher rates of Stamp Duty on additional homes, housing transactions in the UK have remained below their longer-term levels.
This Stamp Duty Holiday is different
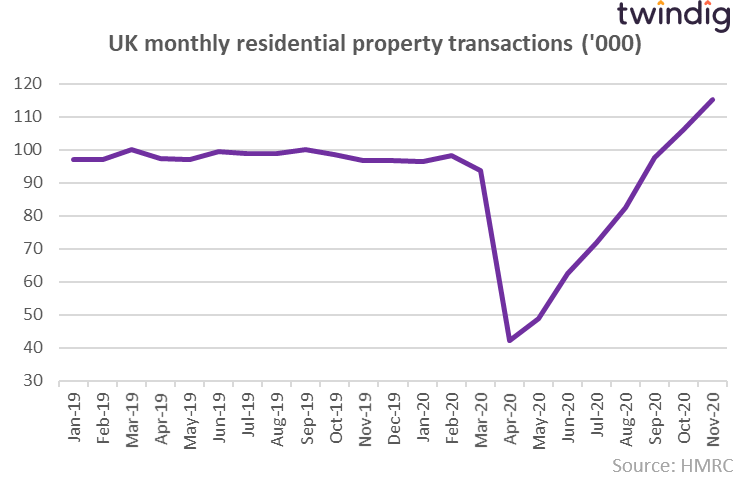
It is difficult to unpick the impacts of the COVID pandemic and the Stamp Duty Holiday on housing transactions. At first, it was clear, housing transactions fell as households stayed at home and during the short period that the UK housing market was closed between the 27 March 2020 and 13 May 2020. Housing transactions increased significantly once the housing market was re-opened as all the frozen housing transactions came off the ice.
UK housing market transactions returned to their trend level by September 2020, arguably before the impact of the COVID related Stamp Duty Holiday was seen in the figures. The Stamp Duty Holiday was announced on the 8 July 2020 and very few housing transactions which started on or after 8 July 2020 would have completed by 30 September 2020.
We would suggest that the above trend housing transactions so far (those above-trend transactions from October 2020 to the end of the COVID stamp Duty Holiday) are a direct result of the Stamp Duty Holiday.
What is the impact of COVID and the Stamp Duty Holiday?
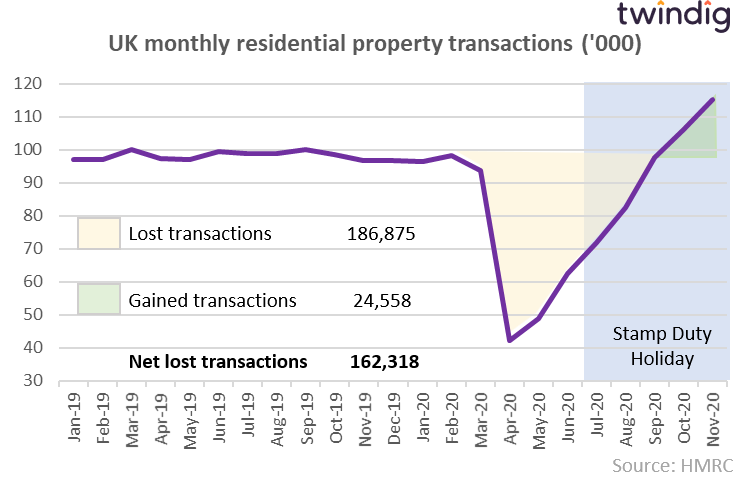
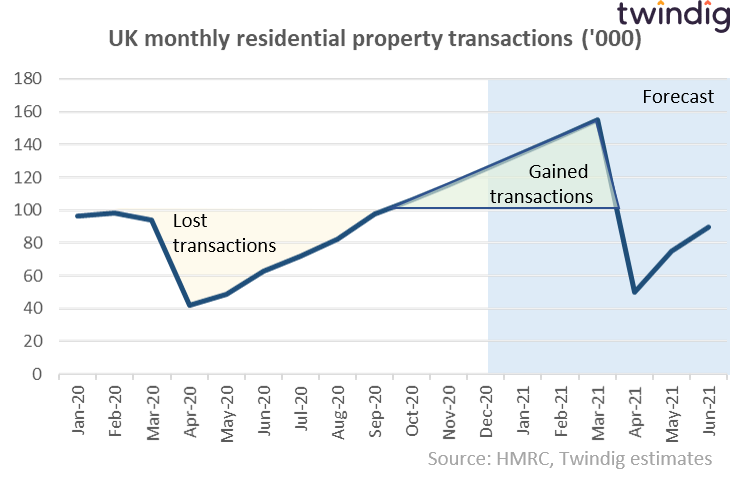
We show our estimate of the number of housing transactions ‘lost’ as a result of the COVID pandemic in the graph below. UK Housing transactions had been relatively stable since January 2019 and we assume that the fall from this stable level is the number of transactions lost. This represented by the yellow shaded area accounts for 186,875 lost transactions.
We show in the green shaded area the level of above-trend housing transactions, which we believe are due the COVID Stamp Duty Holiday. These ‘gained’ transactions total 24,558, which leads to a net loss of 162,318 housing transactions due to the interaction between COVID and the Stamp Duty Holiday.
Our Stamp Duty Holiday Crystal Ball
As we write the Stamp Duty Holiday is due to end on 31 March 2021 and we only have data up to November 2020. Our base case assumption is that the lost housing transactions will be made up by 31 March 2021 after which the level of housing transactions will fall significantly, but quickly returning to trend levels by the summer of 2021. This assumes that the COVID pandemic does not lead to a further closing of the UK housing market.
What happened during previous Stamp Duty Holidays
We look in a bit more detail below at what happened in the lead up to and following previous stamp duty holidays and changes to Stamp Duty.
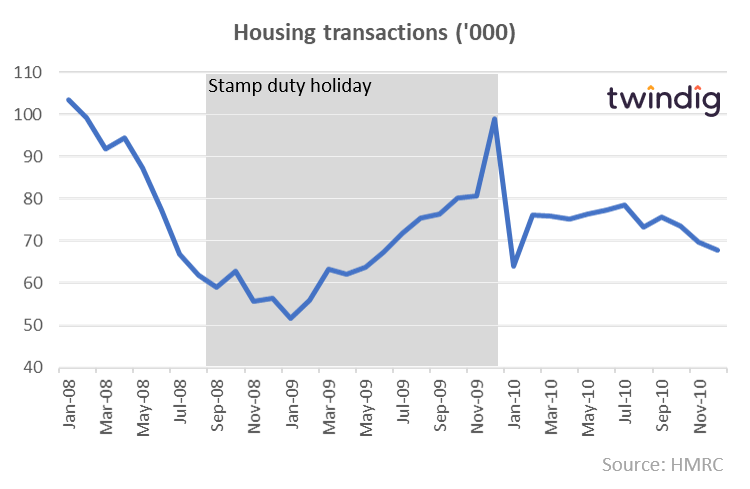
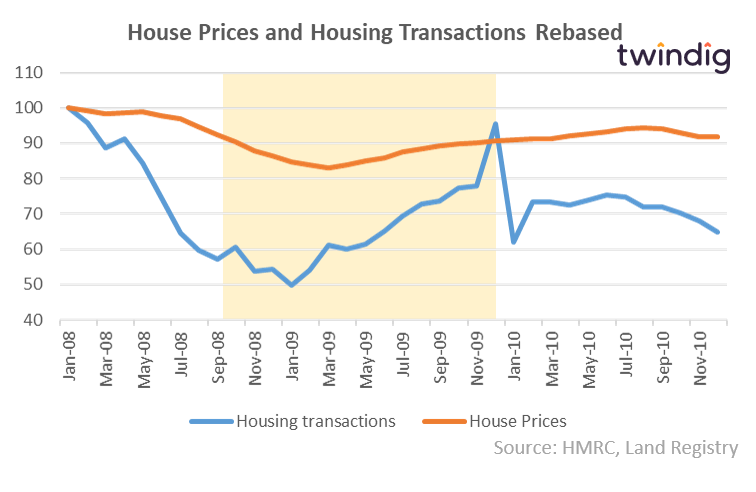
Stamp Holiday: 3 Sep 2008 – 31 Dec 09
Housing transactions trended downwards rather than upwards between September 2008 and January 2008 and only reached their pre-holiday levels in March 2009. The spike in housing transactions at the end of the holiday and subsequent dip, suggests that rather than stimulate more housing transactions it merely gave an incentive for those already considering moving to move a month earlier. Once the holiday was over housing transactions fell back.
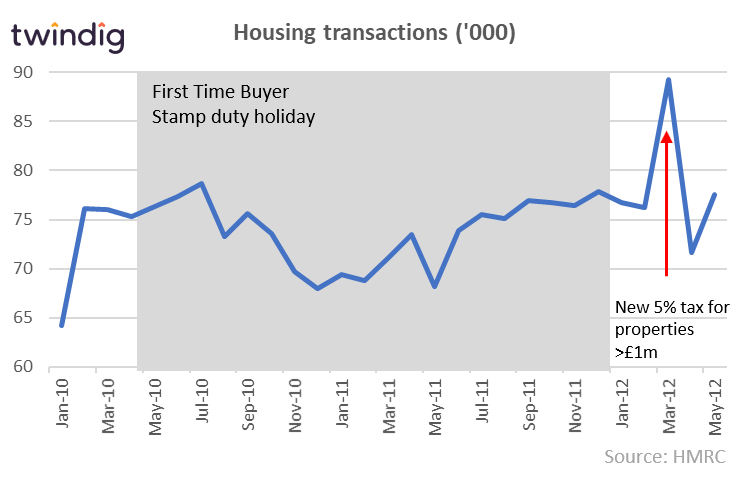
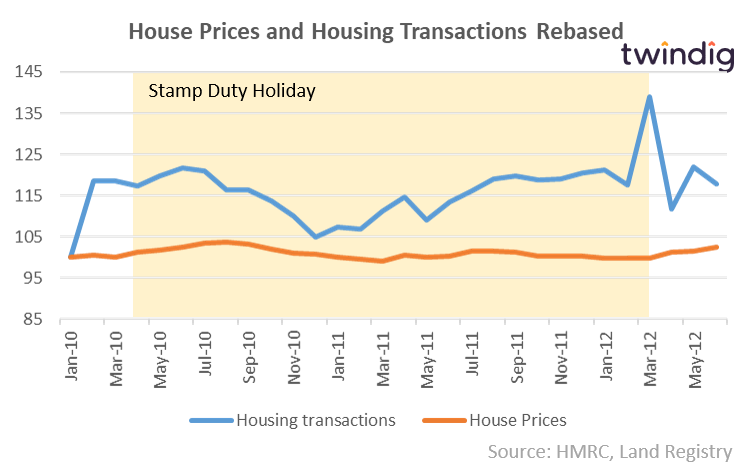
First Time Buyer Stamp Duty Holiday: Mar 2010 –1 Jan 12
Difficult to see how a stamp duty cut stimulated housing transactions, as transactions were below their pre-holidays levels for much of the holiday itself and the spike in transactions came after the holiday. However, rather than a spike in first-time buyer activity, this was more likely to be cash buyers rushing to beat the increase in Stamp Duty effective from April 2012.
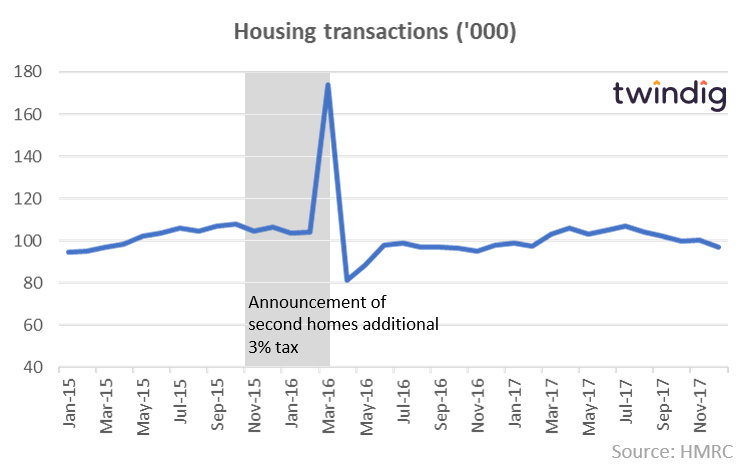
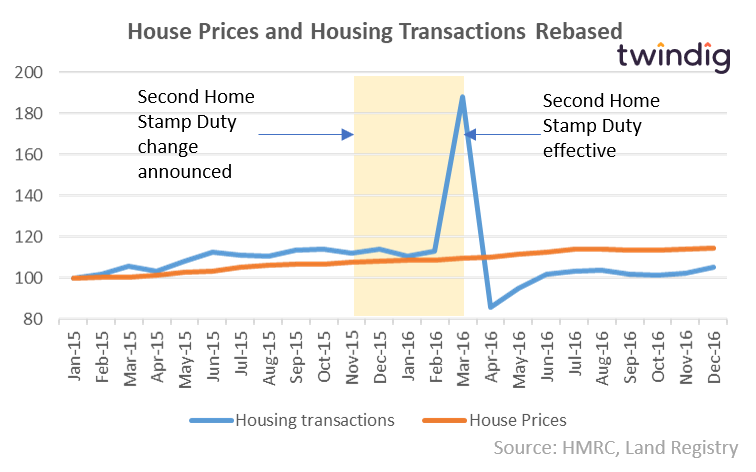
Stamp Duty Increase: Announced Nov 15 effective April 16
The Autumn Statement in November 2015 announced that from April 2016 any home purchase that was not to be the buyer’s primary residence would pay an additional 3% Stamp Duty. This increase, therefore, fell on second homes and buy to let properties. Once again we see a large spike in activity the month before the Stamp Duty change takes place, but in this case, it is difficult to argue that this increase in Stamp Duty had a noticeable impact on the underlying level of housing transactions.
Stamp Duty Holidays and House Prices
Stamp Duty Holiday: 3 Sep 2008 – 31 Dec 09
The first Stamp Duty Holiday was during the Credit Crunch and came at a time when the UK housing market was on its knees, this Stamp Duty Holiday was a welcome one. However, as the chart below illustrates, initially housing transactions continued to fall (September 2008 to January 2009) before gaining momentum and accelerating with a final flourish as the Stamp Duty Holiday came to an end on the 31 December 2009. House prices were already falling and had been falling since September 2007. House prices reached their Credit Crunch lows in March 2009 and rose from April 2009 until August 2010. House prices fell by 1.7% during the Stamp Duty Holiday.
Stamp Duty Holiday: 25 Mar 2010 –1 Jan 12
This Stamp Duty Holiday only applied to First Time Buyers and the impact on housing transactions is difficult to see apart from the spike in transactions as the Stamp Duty Holiday came to a close. House prices were stable throughout the Stamp Duty Holiday and left the Stamp Duty Holiday at the same the level to which they entered it.
Stamp Duty Change 31 March 2016
The Second Home Stamp Duty change was announced in November 2015 ahead of becoming law on 1 April 2016. This change led to the biggest spike in housing transactions we have ever seen as largely chain free and cash buyers rushed to complete transactions ahead of the Stamp Duty increase.
House prices were largely unaffected by the change in Stamp duty continuing their upward trajectory and rose 1.7% between the time the Stamp Duty increase was announced and becoming law. House prices rose a further 2.5% during the remaining months of 2016.
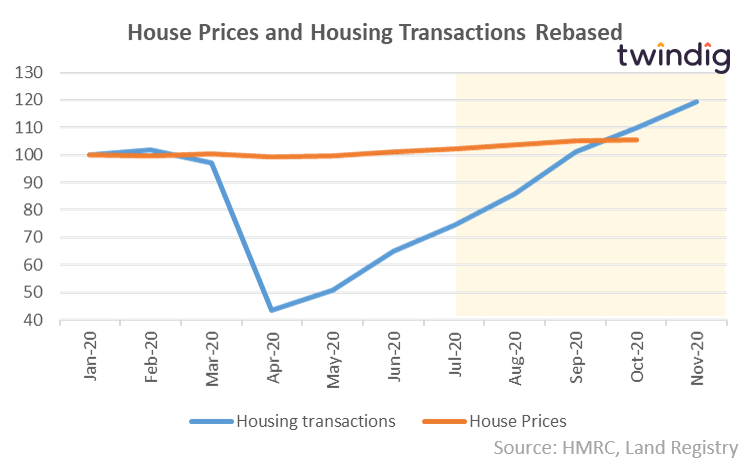
Stamp Duty Holiday: 8 July to 31 March 2021
During the current Stamp Duty Holiday, it appears to us that housing transactions were already recovering and on an upward trajectory before the Stamp Duty was announced. House prices were also on an upward path before the announcement of the Stamp Duty Holiday. We, therefore, question whether the Stamp Duty holiday was needed at all. It seems to be adding fuel to a roaring fire rather than kindling dying embers.
House prices have increased by 4.4% since the start of the Stamp Duty Holiday and the Nationwide House Price index reported that 2020 had seen the house price growth of 7.3% the highest house price growth for six years.
Should the Stamp Duty Cut be extended?
Our thoughts of-course go out to all those who might not complete their housing transaction before the Stamp Duty Holiday ends, but we do not believe that it should be extended. Whilst we believe that many households are in desperate need of a holiday, we do not think that the housing market needed a Stamp Duty Holiday.
We also believe that buying a home is a major life event and one that won’t have been taken solely in the hope of saving a small amount of Stamp Duty Tax.
Extending the Stamp Duty holiday merely pushes the problem further down the road and whilst there could be transition arrangements for those caught in the middle, no transition plan will work for everyone.
We believe that in a period of rising housing wealth (2020 saw the highest house price inflation for six years) and falling tax receipts perhaps those lucky enough to be in a position to buy and those benefitting from house price inflation are also in a position to help the country’s finances.