The 20 hottest streets and highest house prices in Twickenham
House prices in Twickenham have been moving in one direction so far this year, and that direction is up. In this article, we look at the house price trends in Twickenham postcodes TW1 and TW2 and show you the hottest streets in the Twickenham Housing Market, those with the highest prices and provide an outlook for what is to come in the Twickenham Housing Market.
Where are the highest house prices in Twickenham?
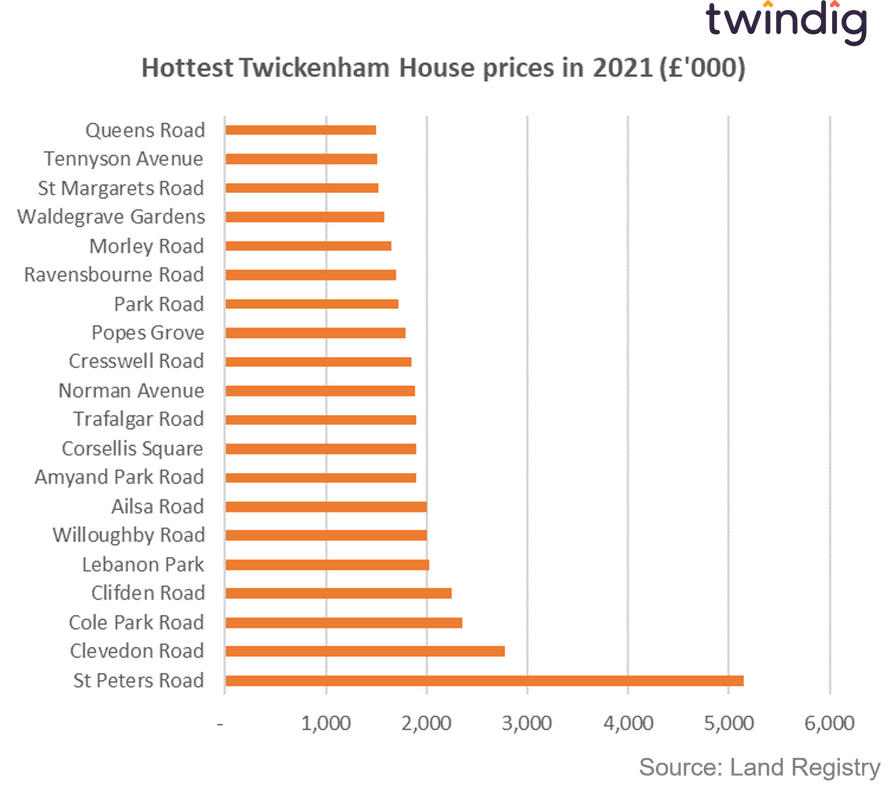
The housing market in Twickenham has been heating up throughout 2021. So far this year the highest house prices have been seen in St Peter’s Road, TW1, where we have seen a home sell for £5,150,000 already this year. This sale is significantly ahead of the second most expensive house sold in Twickenham, which was on Clevedon Road, TW1, for £2,275,000. Taking the final place on the podium is Cole Park Road, TW1, where we saw a home sell for £2,350,000 earlier this year.
We show St Peter’s Road, Clevedon Road, Cole Park Road and the rest of the most expensive 20 streets in Twickenham in the chart below:
How do Twickenham house prices this year compare to last year?
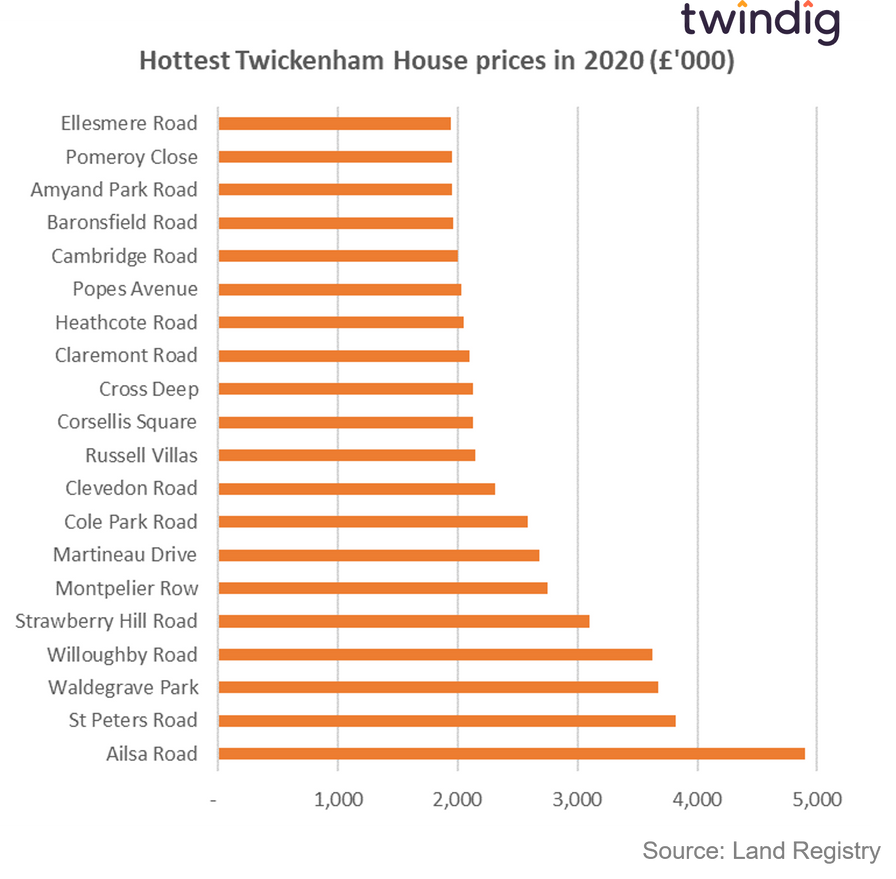
We believe that house prices in Twickenham increased by 8.5% in 2020. The most expensive house sold in Twickenham in 2020 was in Ailsa Road TW1, which sold for £4.9 million. In 2020 St Peter’s Road’s most expensive sale was for £3,820,000, not high enough to take top spot, but not too shabby. In 2020 the third most expensive house in Twickenham was to be found in Waldegrave Park selling at £3,675,000. We show the rest of the top twenty most expensive streets in Twickenham in the chart below
Where are the hottest streets in the Twickenham housing market right now?
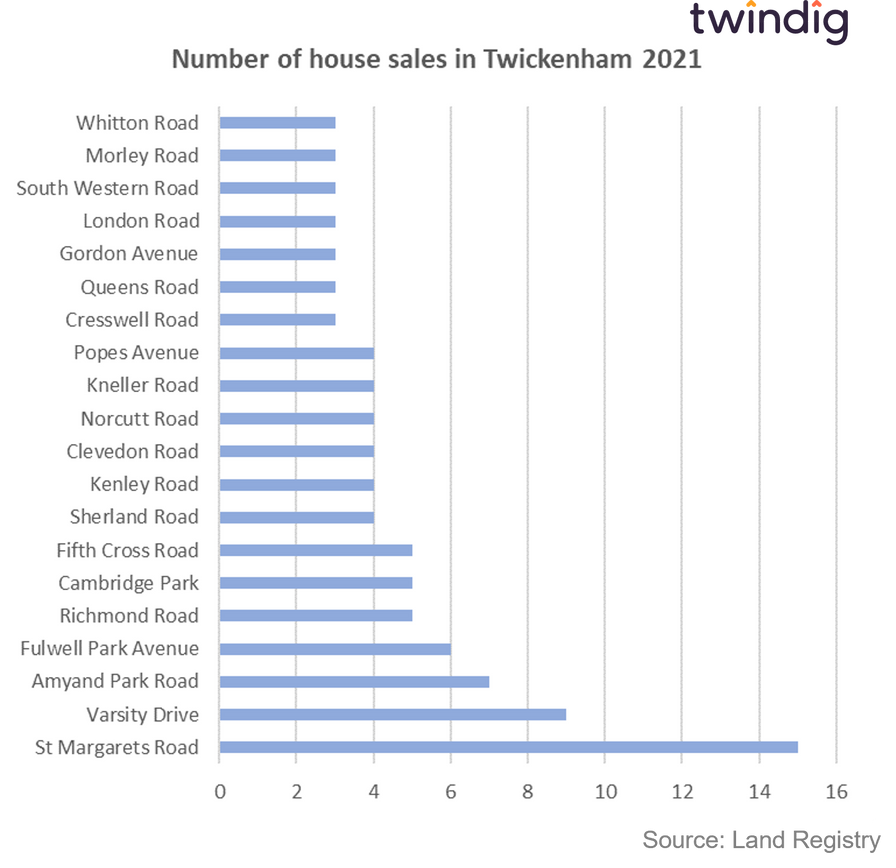
So far in 2021 St Margarets Road has been the hottest street in Twickenham with 15 homes sold, followed by Varsity Drive with 9 sales and Amyand Road with 7 sales making up the podium.
We show the top 20 hottest housing market streets in the table below:
How have the hottest housing markets in Twickenham changed?
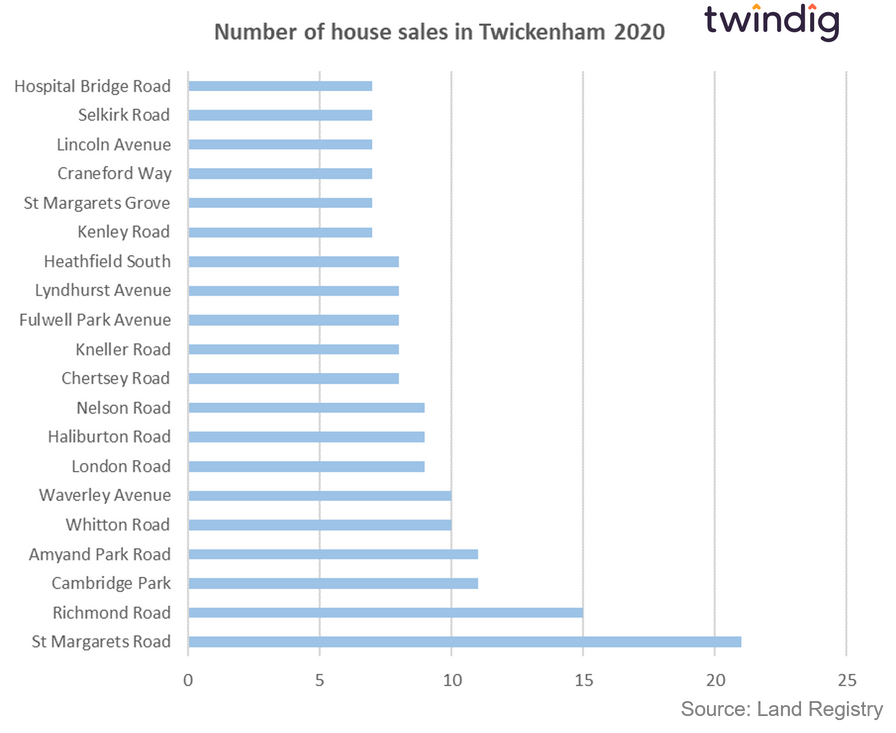
St Margarets Road also topped the Twickenham housing market charts in 2020 with 21 sales followed by Richmond Road with 15 sales and eleven sales for both Amyand Park Road and Cambridge Park.
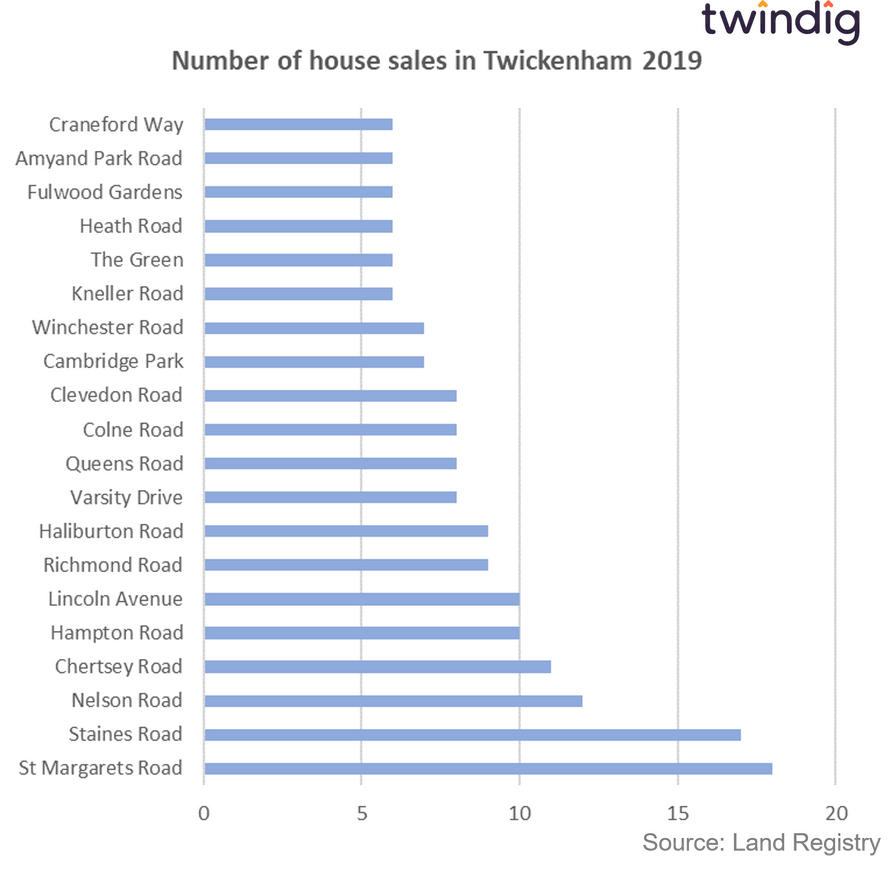
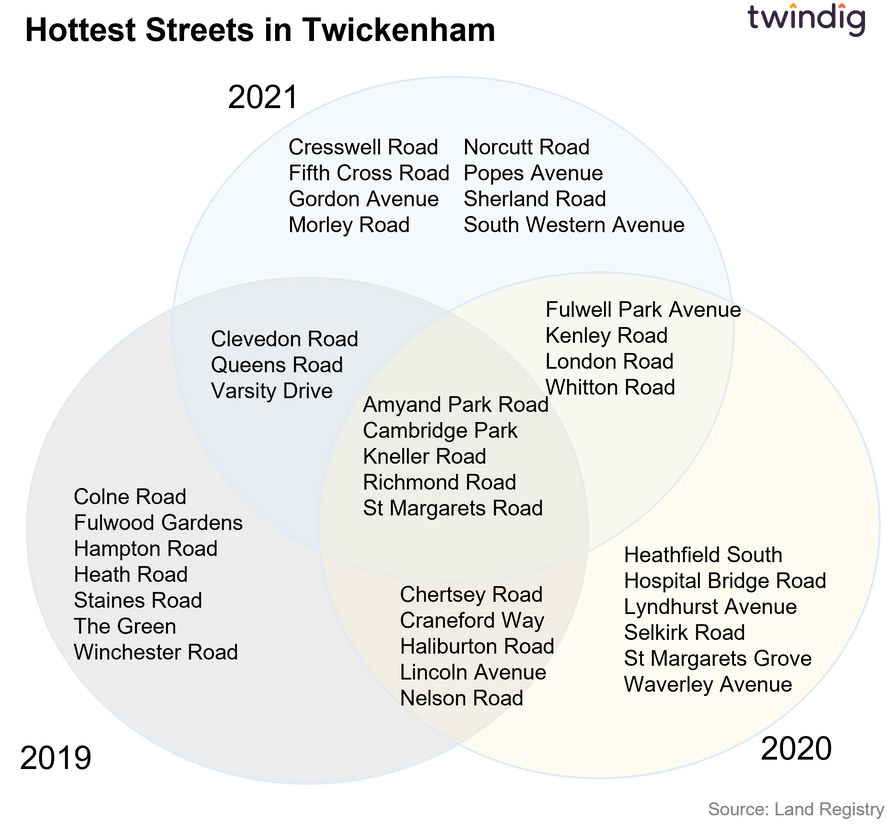
If we look back to 2020, nine of the top streets in 2021 were also in the top 20 in 2020 and eight of the hottest streets in 2021 were also in the hottest 20 in 2019
Has the COVID pandemic impacted the housing market in Twickenham?
We appreciate that the Twickenham housing market in 2020 and 2021 has been impacted by a certain pandemic of the COVID-19 variety, so in the chart below we look at the hottest streets in 2019
Twickenham housing market heat map
We think it helpful to show you how the hottest streets in Twickenham have changed over the last three years, and what better way to do that than by our old friend the Venn Diagram. The diagram below clearly shows which residential streets in Twickenham consistently have a hot and active housing market
Twickenham House prices in context: Is there such a thing as a housing market?
We often read a lot about ‘UK house prices’ and the ‘UK housing market’, but the boffins at Twindig don’t really believe there is a UK housing market, but rather a collection of hundreds and thousands of local markets, which make up the ‘UK housing market’.
Sometimes a town or area, such as Twickenham, has its own housing market and at other times a single street, for instance, St Margaret’s Road Twickenham could be viewed as its own housing market, especially with its numerous flats sought after by both first-time buyers and buy to let landlords.
At the other end of the scale, we would find St Peters Road in Twickenham, sought after by the wealthy and those sometimes just interested in a specific property on one street. We would view the housing market for St Peters Road as a separate housing market to St Margaret’s Road, even though they are both to be found only a stone’s throw away from each other in the St Margaret’s area of Twickenham.
House Prices in the London Borough of Richmond
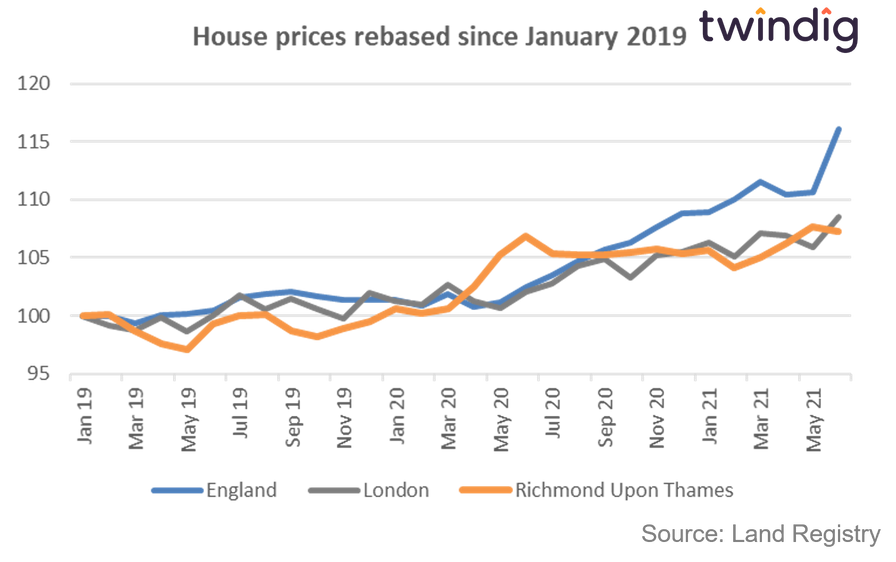
Have house prices gone up or down during the pandemic?
The average house price in Richmond before the first lockdown was £656,740 and this had risen to £690,352 before the start of the Stamp Duty Holiday. The latest house price data from the Land Registry suggests that the average house price in Richmond was £702,845. House prices have therefore increased by £46,105 or 7% since the start of the pandemic, or to put it another way, since the start of the COVID-19 pandemic the average house price in Twickenham has increased by almost £3,000 per month.
Is buying a house in Twickenham a good investment?
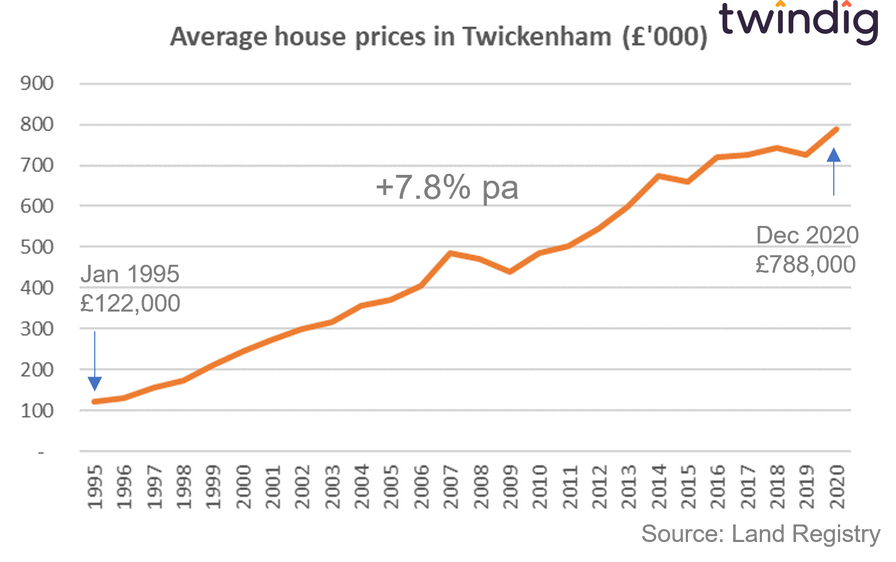
Buying a house in Twickenham has been a very wise investment. The average house price in Twickenham in 1995 was £122,000 and this had increased to £788,000 in December 2020 an increase of, on average, 7.8% per year.
How active was the housing market in Twickenham during the pandemic?
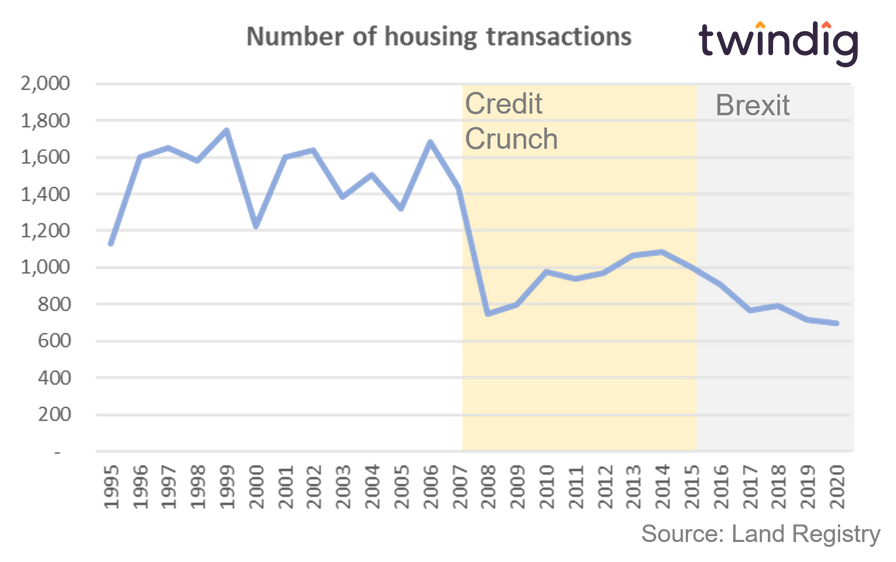
If we look back to 1995, we can see that the volume of housing transactions in Twickenham has yet to return to its pre-credit crunch levels and that uncertainty around Brexit has also led to a continued decline in housing transactions in the Twickenham area.
What has the stamp duty holiday meant for the Twickenham housing market?
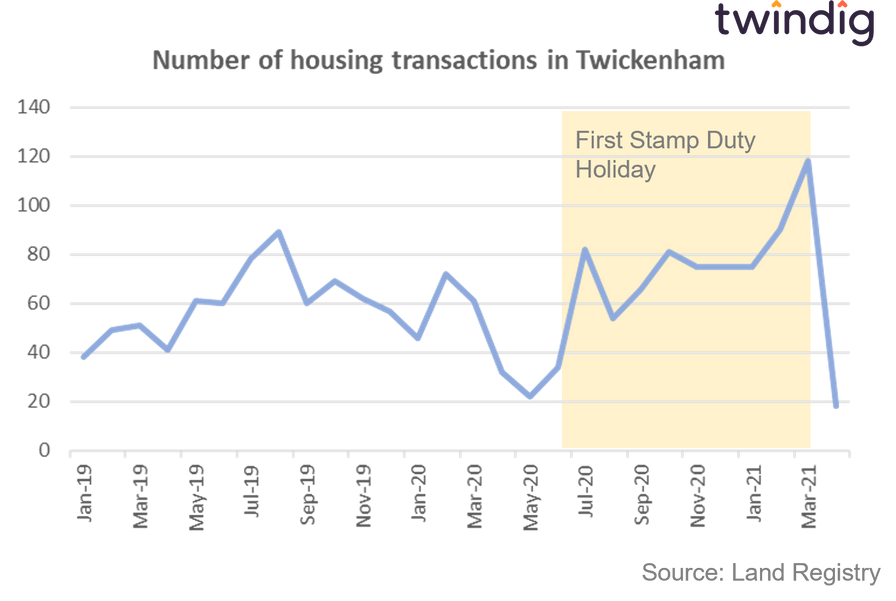
As already noted above, housing transactions in Twickenham have yet to recover to levels seen before the Credit Crunch. However, housing transactions were clearly boosted by the Stamp Duty Holiday. We can see in the graph below that housing transactions fell during the first part of lockdown one, when the Twickenham housing market was effectively shut - transaction levels fell in March, April and May 2020. They started to recover in June 2020, but were boosted significantly by the Stamp Duty Holiday.
The significant fall in housing transactions in April 2021 highlights the power of the Stamp Duty Holiday in Twickenham. The stamp duty holiday was originally intended to end on 31 March 2021, before being extended at the eleventh hour so those completing a purchase in April 2021 had to assume they wouldn't benefit from the holiday and as a result, the number of transactions fell significantly.
Twickenham house price forecast
We believe that the outlook for house prices in Twickenham is positive and we believe that house prices in Twickenham will be 5% (or c.£35,000) higher in a year's time than they are today.
Although the Stamp Duty Holiday draws to a close in September 2021, September is also the start of the Autumn Selling Season, which kicks off as families return from holidays and children return to school. It is an important time for those looking both to move and settle in their next home before Christmas. We also believe that the housing market will return to more normal levels of activity as we learn to live with COVID and as we move from many working fully from home to a hybrid model of working 2-3 days a week in the office and 2-3 days at home. As the economy regains its composure we expect house prices in Twickenham to continue to rise.