Stamp Duty Gap Year - one year in - who is winning?

On 8 July 2020 in his Plan for Jobs speech Chancellor Rishi Sunak announced a Stamp Duty Cut designed to bolster housing transaction levels and underpin house prices:
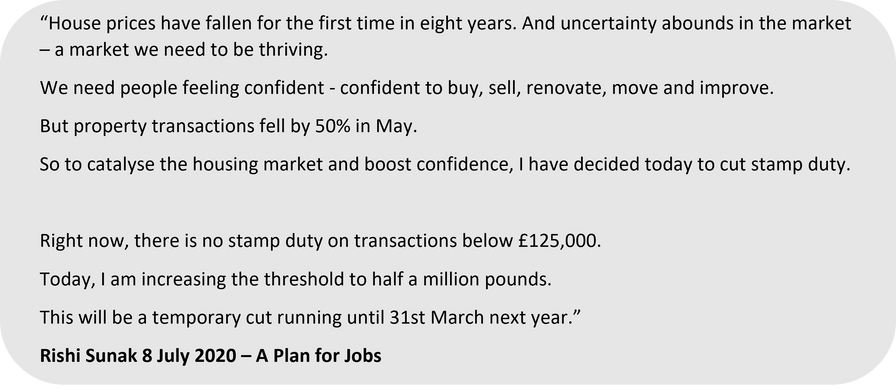
The Stamp Duty Holiday turned into a Stamp Duty Gap Year after it was extended and we now have data relating to the gap year and the gap year is a story of winners and losers, but which are you?
In this article, we look at the latest provisional data on house prices and housing transactions to see if the Stamp Duty Holiday achieved what it set out to do. Drilling down to the local authority level for house prices.
What did house prices do in their gap year?
Across the UK house prices have grown significantly since the start of the Stamp Duty Holiday, reaching a record high in June 2021 of £265,668 an increase of £31,000 or +13.2% since the start of the Stamp Duty Holiday. This has been welcome good news in challenging times for those selling homes, but not so welcome news for those buying. The stamp duty holiday has been an expensive holiday.
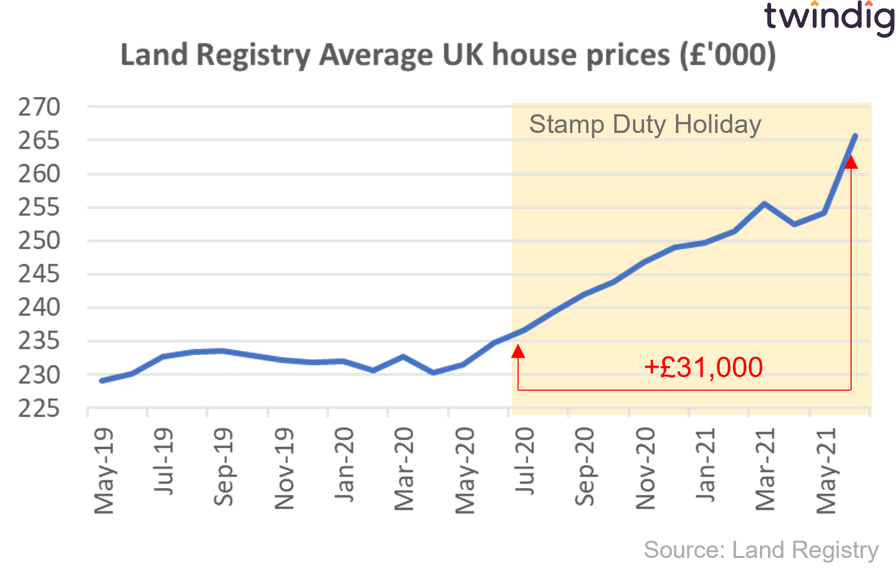
The Stamp Duty Saving on the averagely priced home was just £3,283 before 1 July falling to £2,500 from the 1 July 2021. If you completed on the 30 June 2021, the stamp duty holiday rather than saving you £3,283 left you out of pocket by £27,682 and from 1 July 2021 that figure rises to £28,465 when you take into account that average house prices have increased by £31,000 since the Stamp Duty Holiday was announced.
The biggest house price winners and losers
We have crunched the house price data across each of the 375 areas reported by the Land Registry to show you who is hot and who is not when it comes to house prices
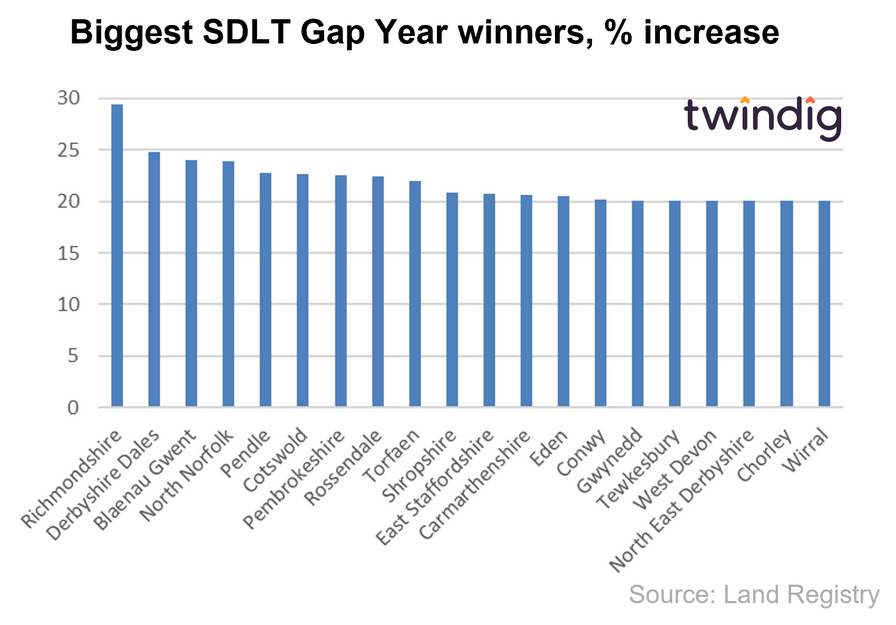
The biggest winners in percentage terms
The biggest winner in percentage terms was Richmondshire, which is located in the northern area of the Yorkshire Dales including Swaledale and Arkengarthdale, Wensleydale and Coverdale. During the stamp duty holiday, house prices in Richmondshire increased on average by 29.4% (or £62,632). In second place up 24.7% were the Derbyshire Dales with Blaenau Gwent in third with average house prices up 24.1%. The complete top 20 can be seen in the chart below.
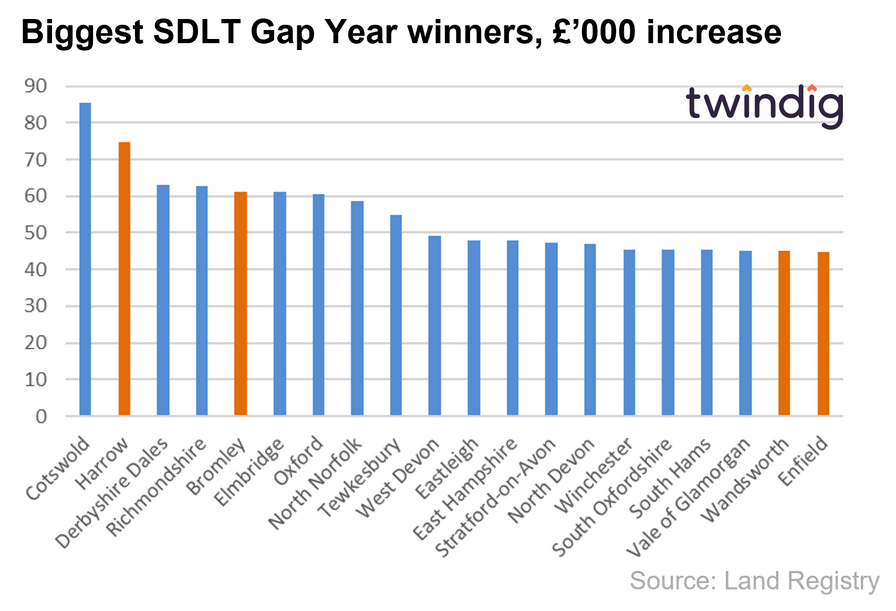
The biggest winners in monetary terms
Whilst percentages are great, money buys houses, so which areas went up the most in monetary value terms. We show the top 20 areas in the chart below. In our view what is most interesting is that it is not that areas with the highest house prices which dominate the top 20. Only four London boroughs make the cut, Harrow, Bromley, Wandsworth and Enfield. House prices have increased the most in the Cotswolds (up £86,000 on average) and leafy, rural and coastal areas leave little room for urban hotspots. Perhaps this is indicative of the pandemic penchant for working from home or the race for space as we were all locked in our homes.
The jury seems to be out on the longevity of wfh, but we believe that most workers have a preference for a bit of both rather than either-or, and a hybrid 2-3 days at home or in the office seems to be the consensus
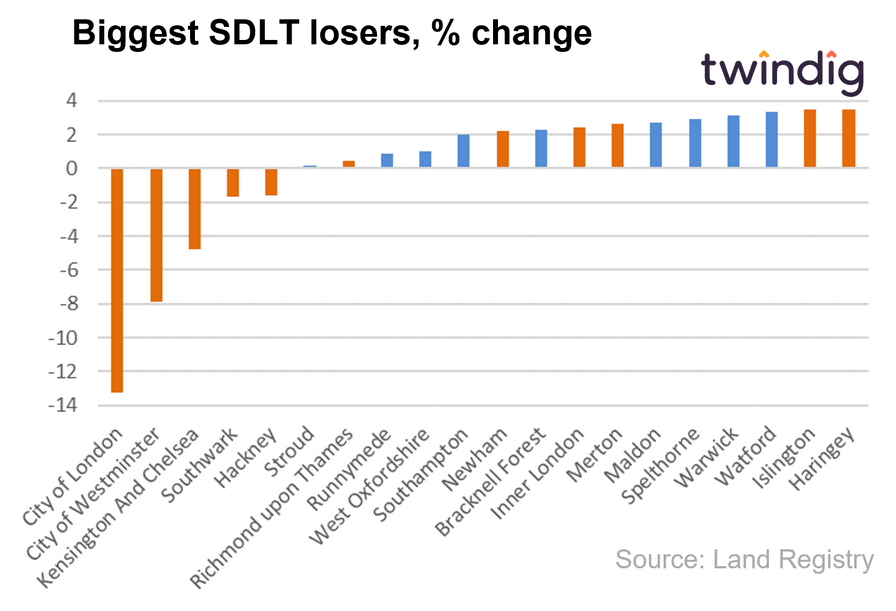
The biggest losers in relative terms
Whilst London was largely absent from the winners tables, it has taken control of the relative losers table. The five biggest losers can all be found in London and the three most expensive boroughs in London comfortable fill the top three places. The top five are joined by a further six London boroughs, although those six (Richmond on Thames, Newham, Inner London, Merton, Islington and Haringey) did see house prices rise..., just not by very much.
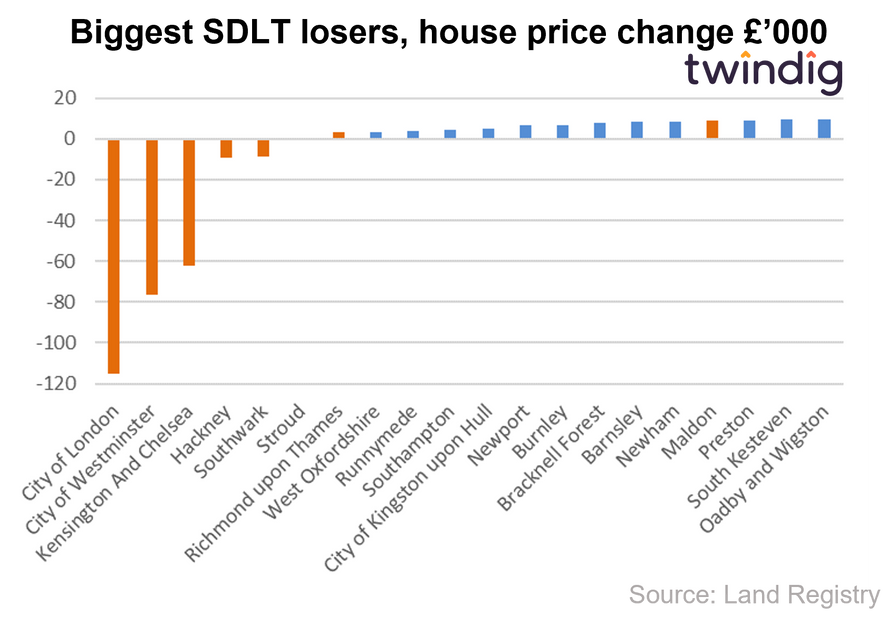
The biggest losers in absolute terms
London once again finds itself at the bottom of the class, once again taking the bottom five places. Average house prices in the City of London have fallen by more than £100,000 and the high house price boroughs of the City of Westminster and Kensington & Chelsea join the City on the losers podium.
Housing transactions
The Stamp Duty Holiday had two jobs to do: underpin house prices and kick start housing transactions. It certainly underpinned house prices, in fact, it raised them to record levels, but did these house price rises come at the expense of housing transactions?
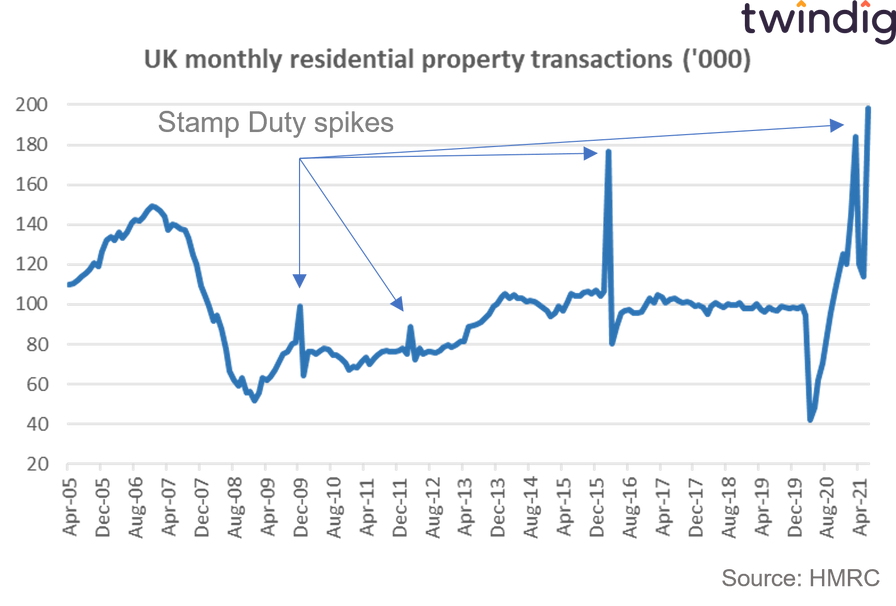
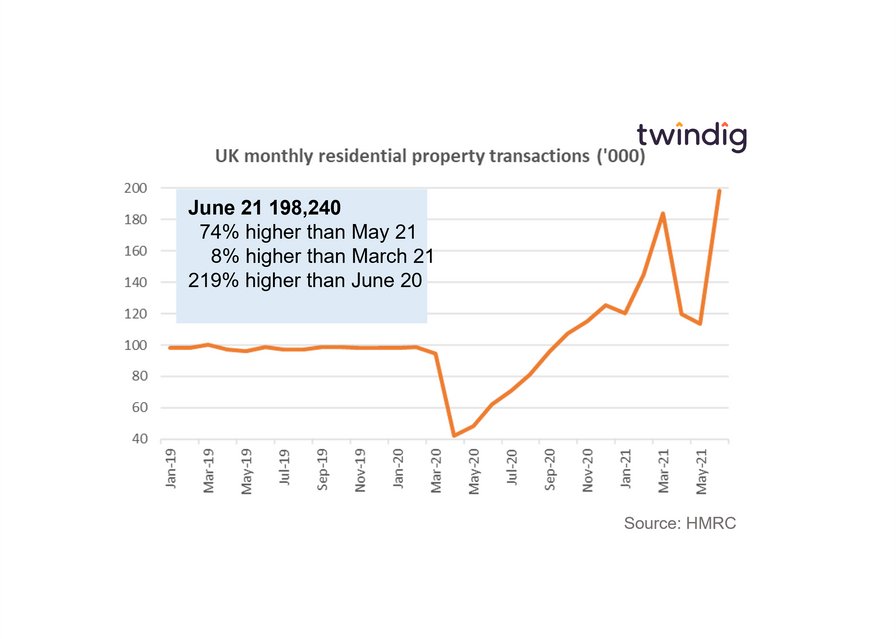
In a word.. no. As we show in the chart below, housing transactions in June 2021 were double their levels of a year earlier and 74% higher than in May 2021.
The spike in March 2021 is a vivid reminder of what happens at the end of a stamp duty holiday. Thousands rush to complete before the deadline. So big was the rush in March that the UK Government extended the full Stamp Duty Holiday out to 30 June 2021 to allow those caught in chains to complete and offered a smaller holiday (the Stamp Duty threshold was reduced from £500,000 to £250,000) out until 30 September 2021 when the SDLT threshold will return to its pre-pandemic level of £125,000. The June spike was therefore expected and we are likely to see a third and final spike in September.
We show in the chart below a longer-term view of housing transactions and highlight (not that highlighting is really required) the previous changes to stamp duty rates and stamp duty holidays.