Property Market Insights: Mortgage approvals and housing affordability
In this week's episode Daniel and I look at the latest mortgage approvals, mortgage rates and a deeper dive into housing affordability
The best way to watch the podcast is on youtube, but if you are using a player such as Spotify we include the key charts we refer to in the video below:
Housing affordability
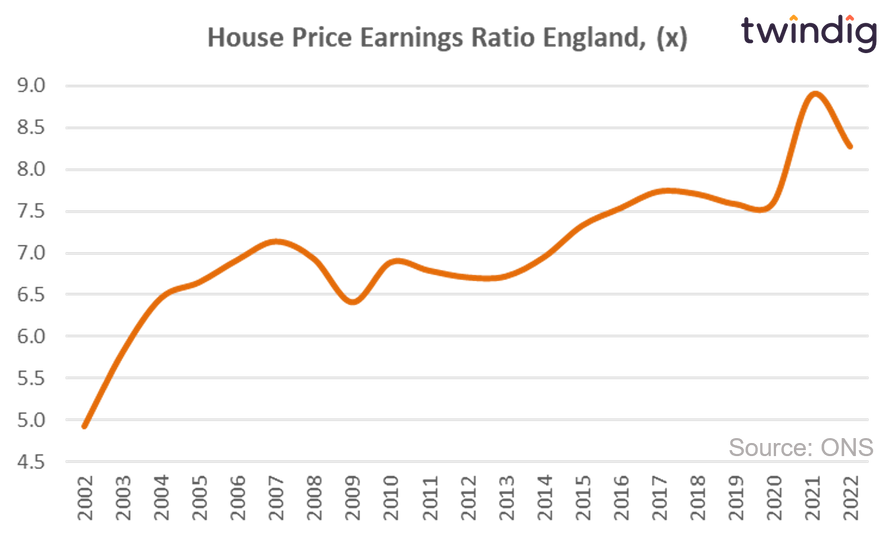
The chart below shows the standard house price-earnings ratio - this is the number of years salary you need to buy the average house in the UK.
The average HPER has risen from just under five times (4.9x) in 2002 to just over eight times (8.3x) in 2022.
Rent inflation
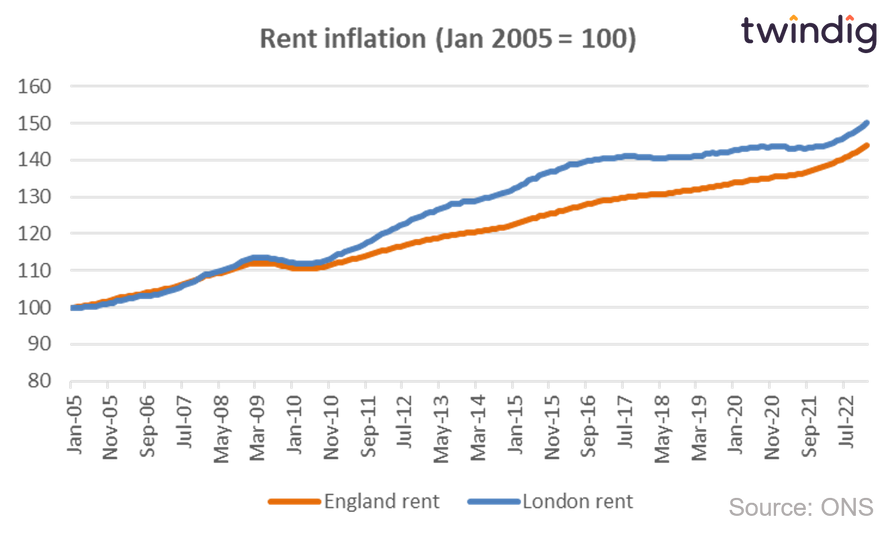
The chart below shows rent inflation for north England and London. The graph shows that rents in London have increased by just over 50% since January 2005 and by 40% on average across England.
Rent inflation vs house price inflation
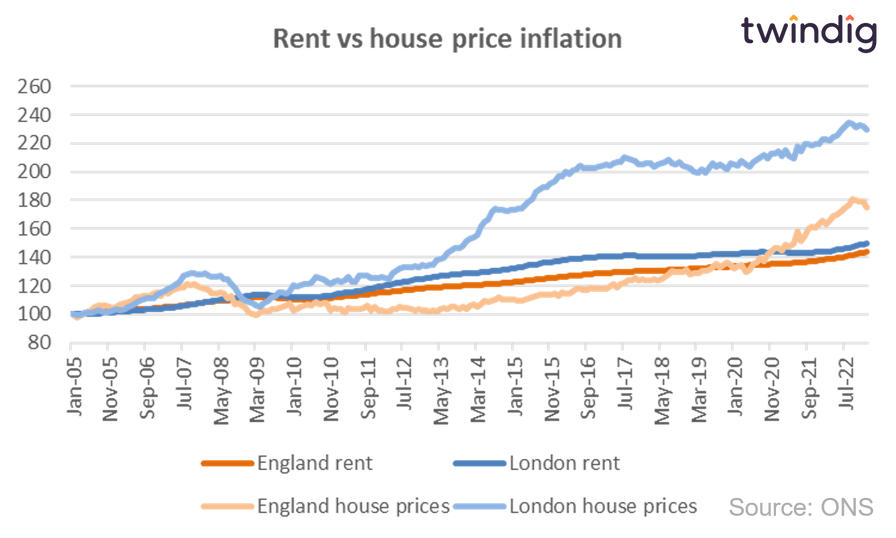
Although rents have increased significantly over the past few years, rent inflation has not kept pace with house price inflation, as illustrated in the graph above. Whilst average rents in England are up 40%, house prices have increased by 75% and in London, rents are up 50%, but average house prices have increased by 130%.
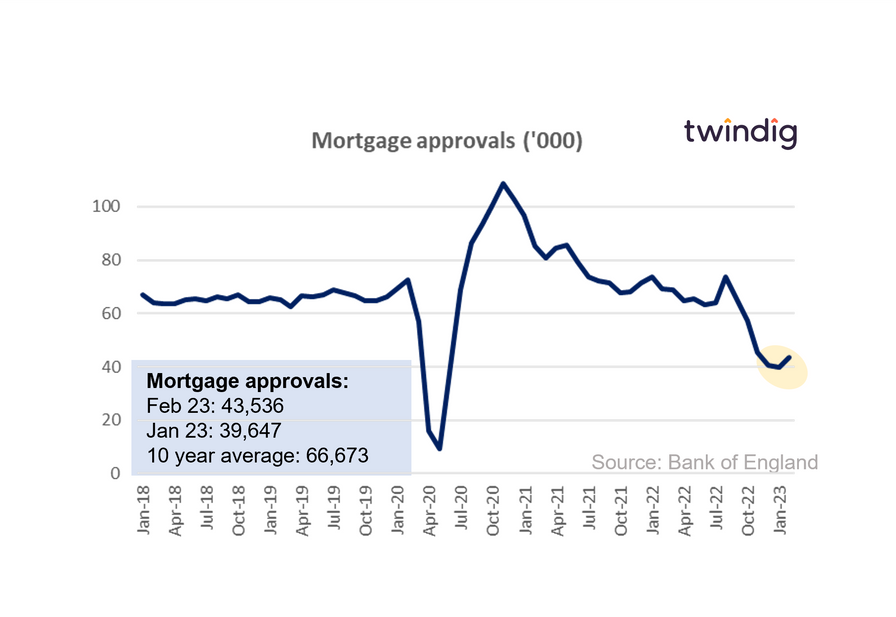
Mortgage approvals
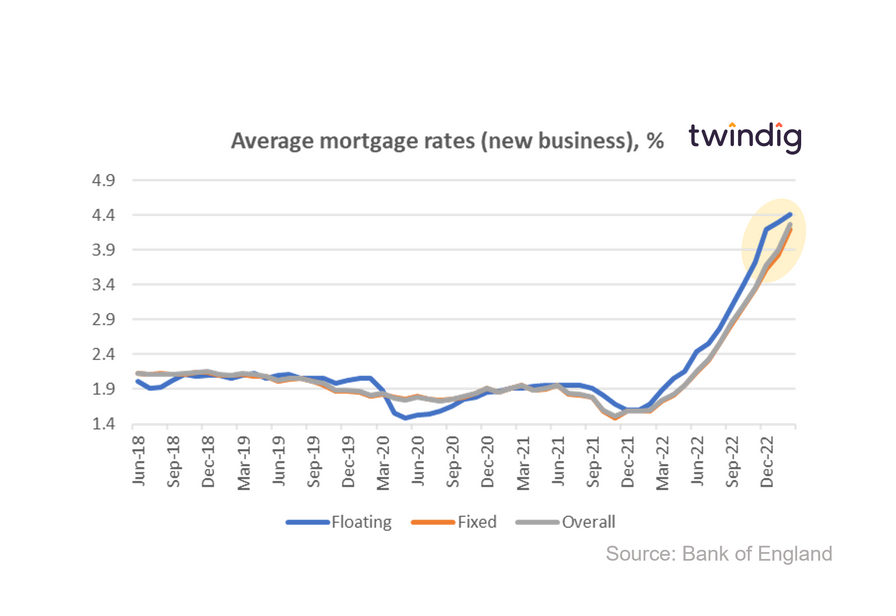
Mortgage rates