Will house prices fall as interest rates rise?

Received wisdom suggests that as interest rates rise, house prices will fall. At first glance, this makes sense as the cost of mortgages rises, the size of mortgages will fall, putting downward pressure on house prices.
Many are, therefore, nervous that house prices will fall as the Bank of England continues to raise its Bank Rate (the underlying interest rate that impacts all other interest rates).
Twindig is not claiming to be able to predict the future, but we can look at the interaction between house prices and interest rates in the past.
Since 1983 there have been 13 periods of either rising or falling interest rates. We have looked at each, in turn, to see if a pattern emerges. A pattern does emerge, but not the one received wisdom suggests.
A correlation, but not the one we were expecting...
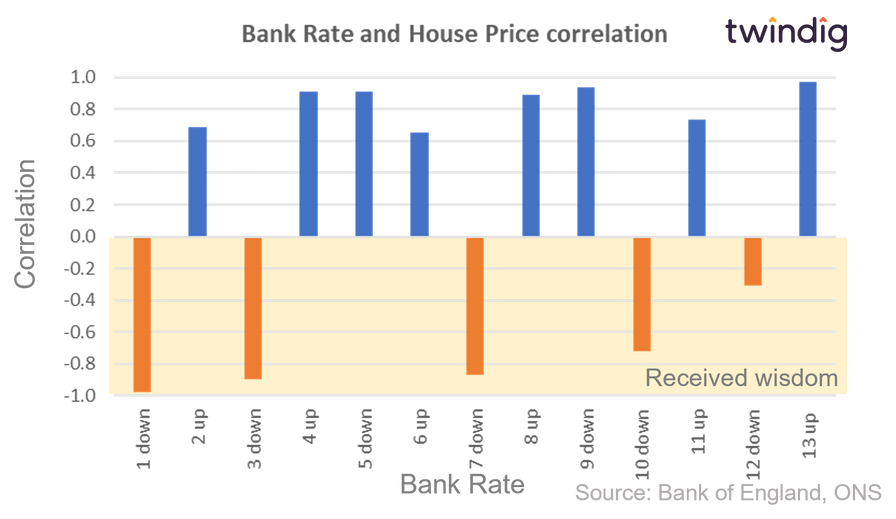
The hypothesis we were testing was that if interest rates go up house prices come down, in technical terms a 'negative correlation'.
However, when we look at the 13 periods of either rising or falling interest rates since January 1983 we only see the 'received wisdom' negative correlation five times and a positive correlation - where interest rates and house prices move in the same direction eight times.
We also note that overall, the positive correlation is stronger (closer to 1.0) than the negative correlation is closer to minus -1.0.
This suggests to us that the received wisdom is not that wise...
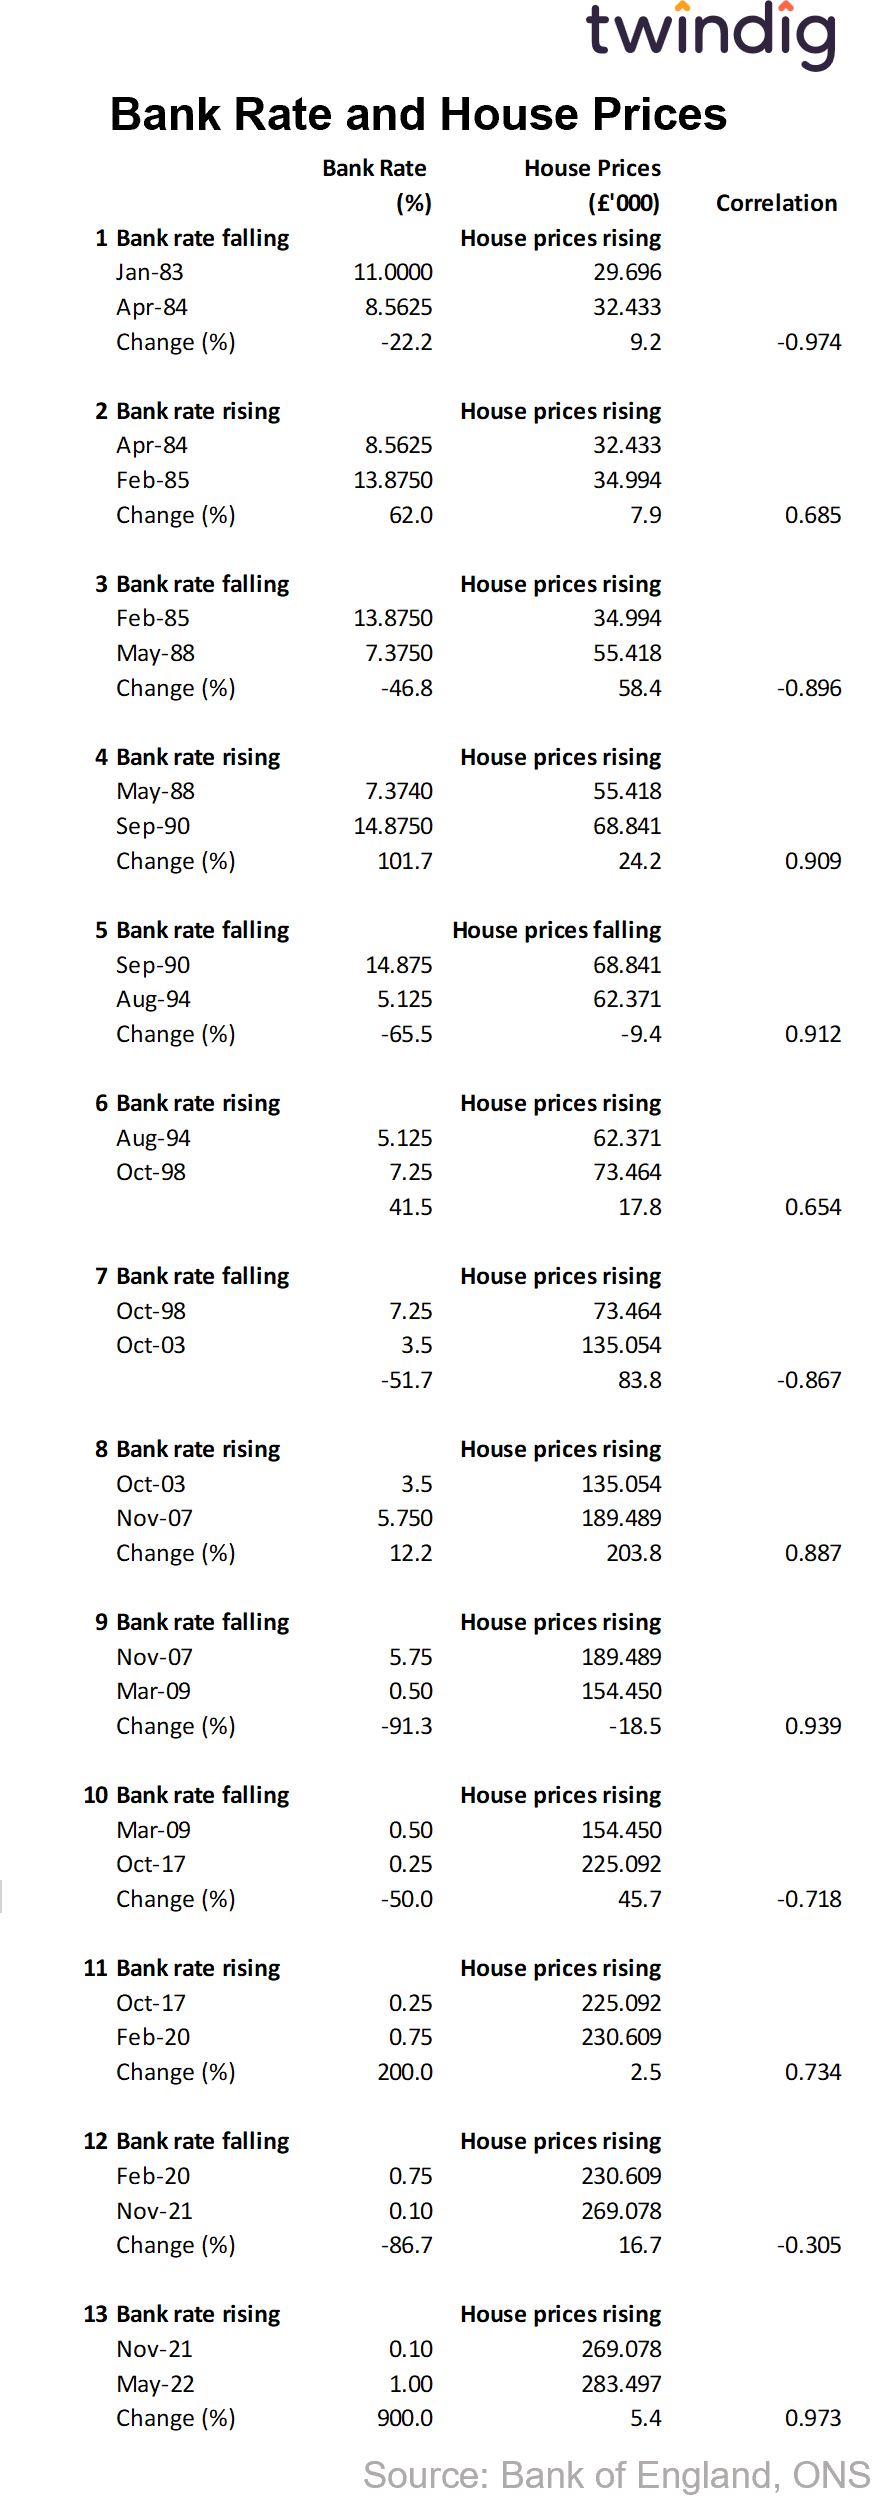
The table below splits out each period of falling and rising interest rates since 1983 and looks at what happened to house prices. The first period follows the received wisdom, between January 1983 and April 1984 Bank Rate fell by 22% and house prices rose by 9.2% a negative correlation of -0.974 (where -1.0 is a perfect correlation). We are not saying that the fall in interest rates caused house prices to rise, but we are noting that they did.
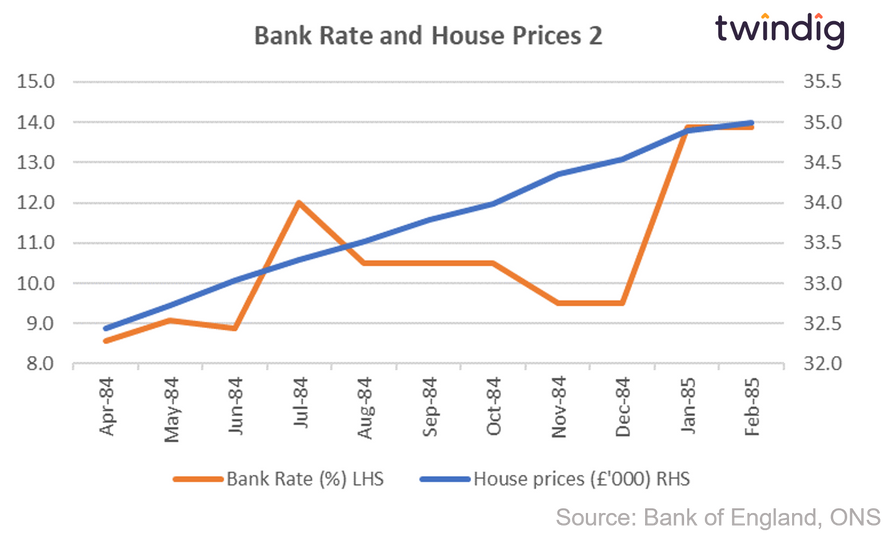
However, after the fall, interest rates rose, rising by 62% from 8.6% in April 1984 to 13.9% in February 1985. This is a very big increase when we consider at the time of writing Bank Rate was just 1.25%, and house prices increased by 7.9% in this period, a positive correlation of 0.685, the opposite of what was expected.
Overall across the 13 periods we only see a negative correlation 5 times and a positive correlation 8 times. Interestingly the positive correlations are almost twice as strong as the negative correlations.
We break each of the thirteen periods out in the charts below
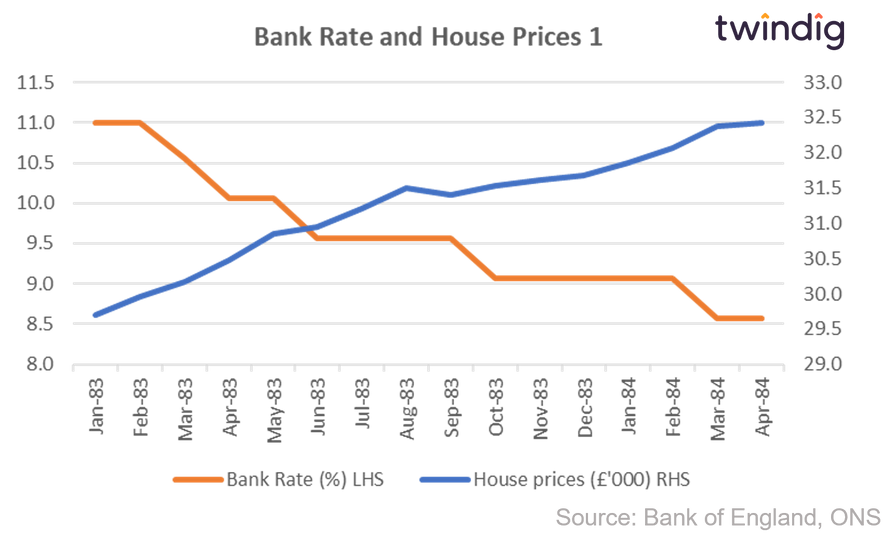
Interest rates and house prices Jan 1983 to April 1984
House prices rise as Bank Rate falls for 15 months
Interest rates and house prices April 1984 to Feb 1985
House prices rise as Bank Rate rises for 10 months
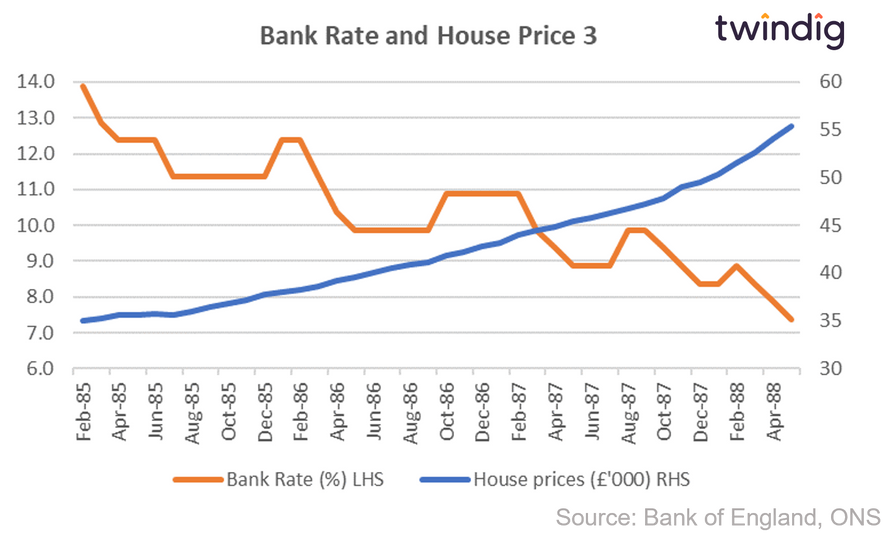
Interest rates and house prices Feb 1985 to May 1988
House prices rise as Bank Rate falls for 39 months
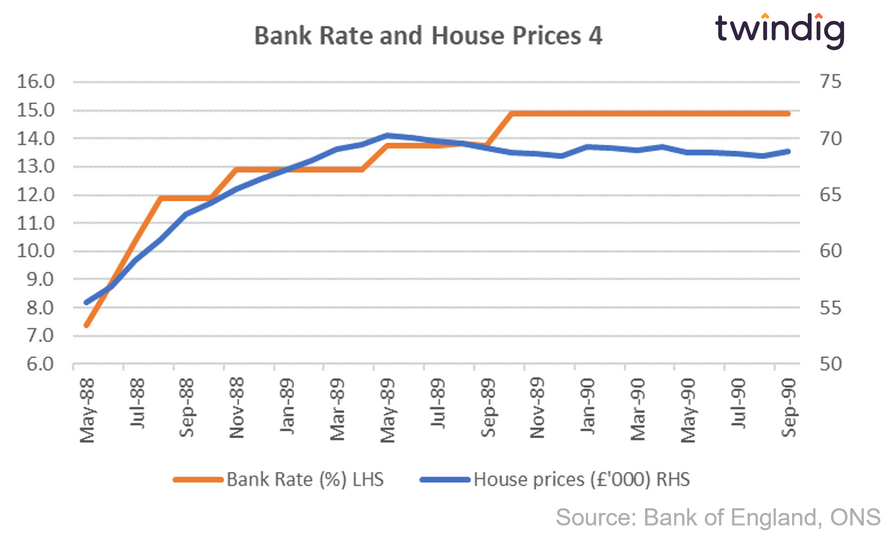
Interest rates and house prices May 1988 to Sep 90
House prices rise and Bank Rate rises for 28 months
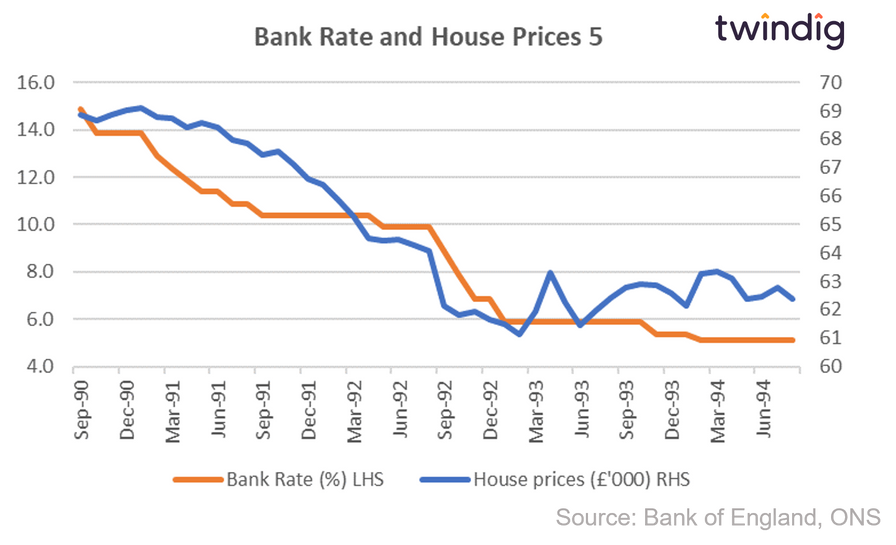
Interest rates and house prices Sep 90 to Aug 94
House prices fall as Bank Rate falls for 47 months
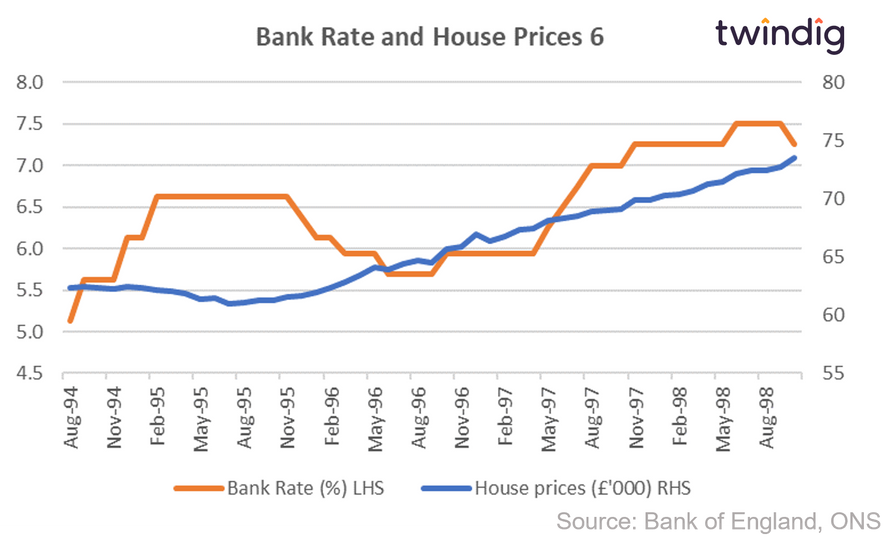
Interest rates and house prices Aug 94 to Oct 98
House prices rise as Bank Rate rises for 50 months
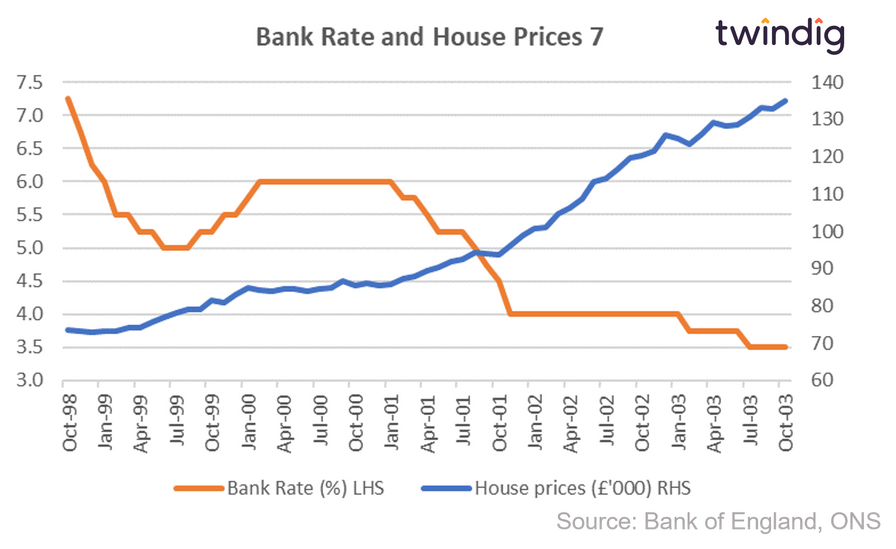
Interest rates and house prices Oct 98 to Oct 03
House prices rise as Bank Rate falls for 60 months
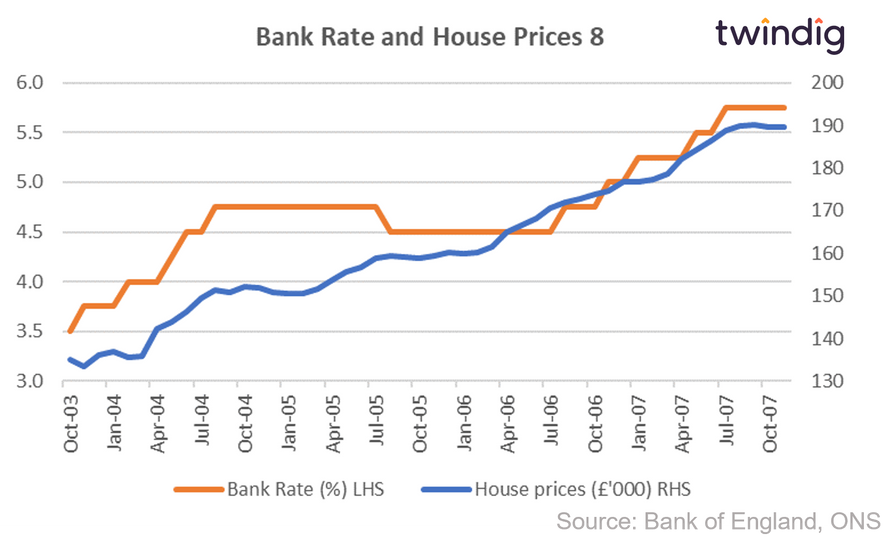
Interest rates and house prices Oct 03 to Nov 07
House prices rise as Bank Rate rises for 49 months
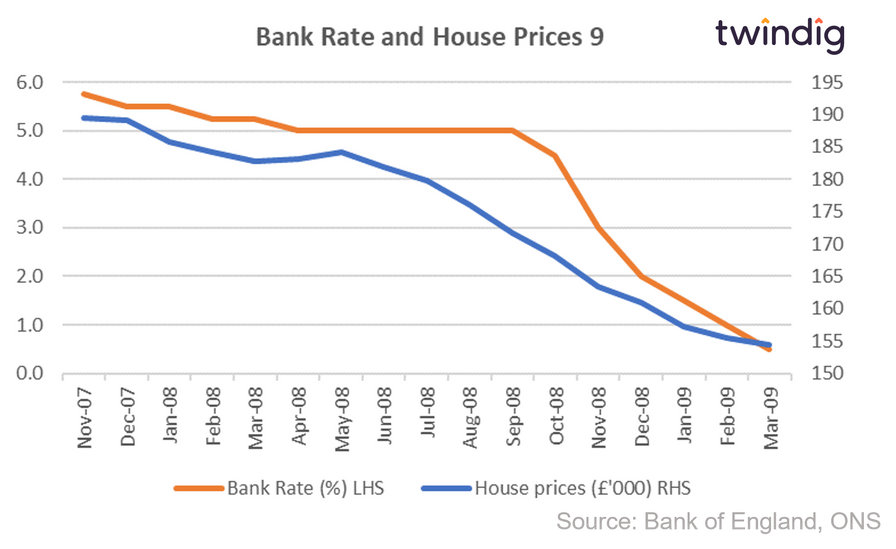
Interest rates and house prices Nov 07 to Mar 09
House prices fall as Bank Rate falls for 18 months as the Global Financial Crisis hit the housing market very hard
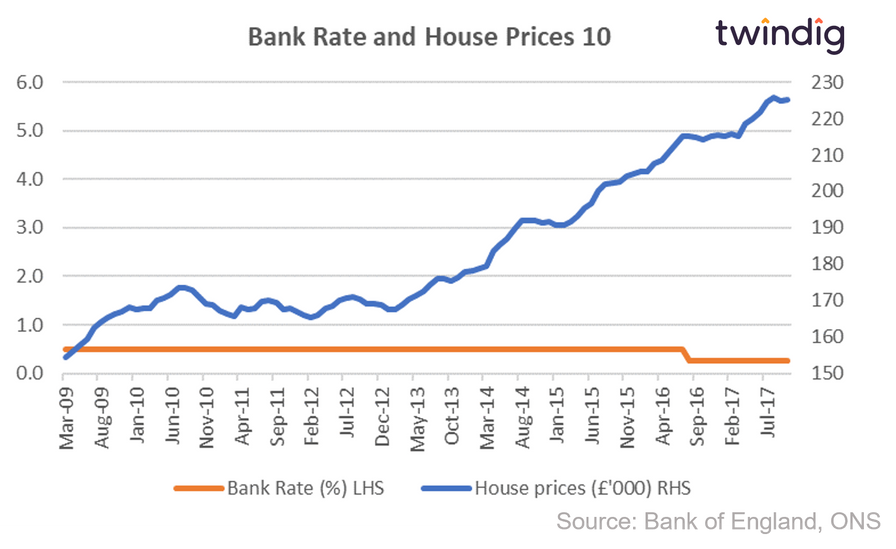
Interest rates and house prices Mar 09 to Oct 17
House prices rise as Bank Rate falls (just) for 103 months
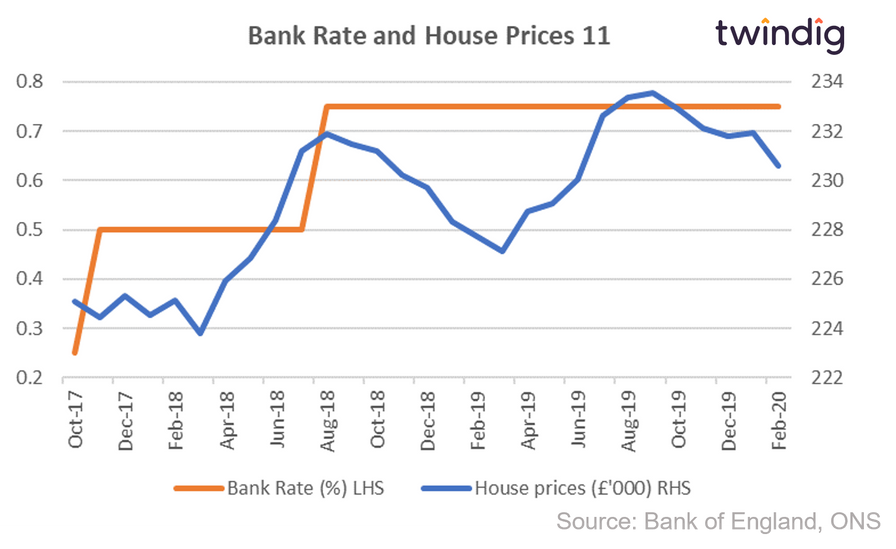
Interest rates and house prices Oct 17 to Feb 20
House prices rise as Bank Rate rises for 28 months
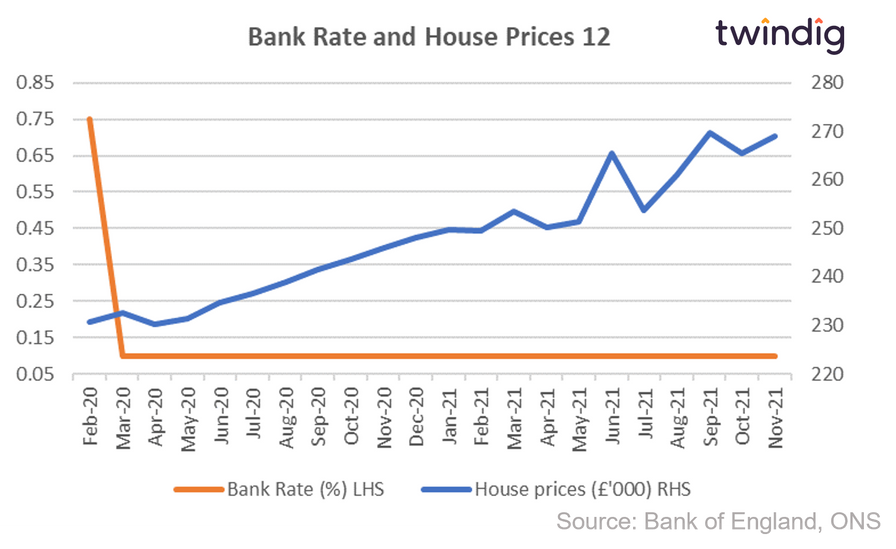
Interest rates and house prices Feb 20 to Nov 21
House prices rise as Bank Rate falls for 22 months
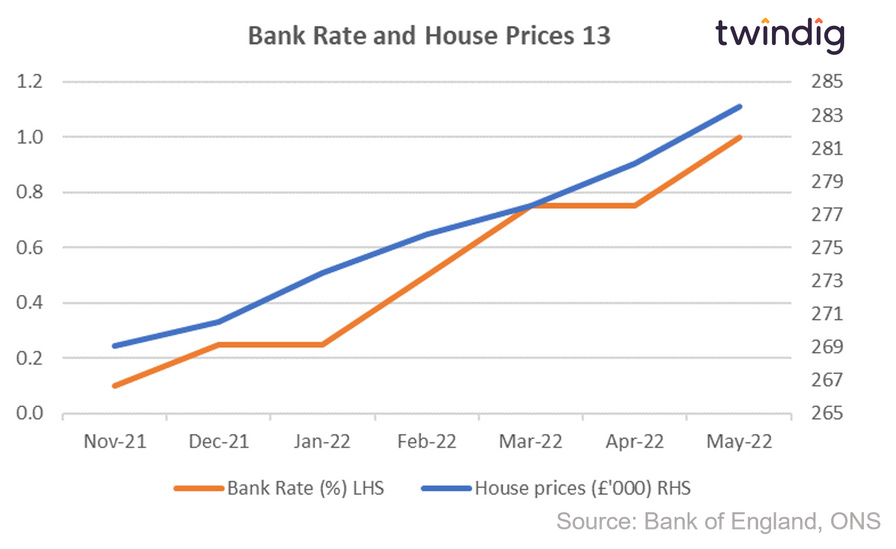
Interest rates and house prices Nov 21 to May 22
House prices rise and Bank Rate rises for 6 months