House prices: Brexit vs Covid

What did Brexit and COVID do for house prices?
In this article, we look at what has had the biggest impact on house prices Brexit or COVID-19, one an event that impacted the UK significantly and caused a minor headache for its trading partners, the other a situation which rocked the entire globe.
Both had a significant impact on the UK economy, but the impact of both on house prices was not what anyone actually predicted.
The headline is that, so far COVID-19 has had a very positive impact on house prices, much larger than the impact of Brexit, but is the devil in the detail?
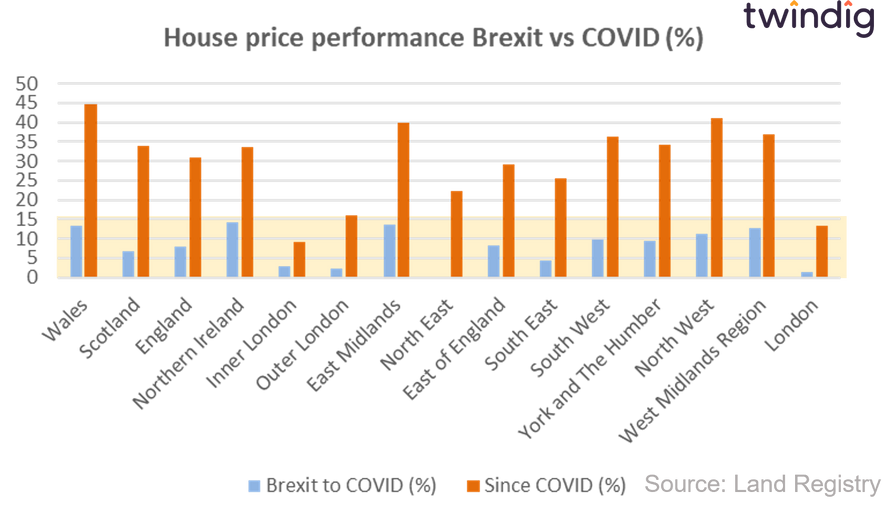
Brexit vs COVID regional house prices - percentage change
The chart below shows the percentage change in house prices from June 2016 to February 2020 (the period from Brexit to COVID) and the period since February 2020 (Since COVID). Although the Brexit to COVID period is almost twice as long as the period since COVID it is clear that across all regions of the UK house prices have grown in percentage terms significantly more since COVID than in the period between the EU referendum and the first COVID lockdown.
The biggest percentage increase in house prices from Brexit to COVID was in Northern Ireland up 14.1% and the smallest increase was in the North East 'up' just 0.07%
However, turning to house price performance since February 2020, the smallest increase is in Inner London up 9.1% and the largest increase, was, again in Wales up 44.8%.
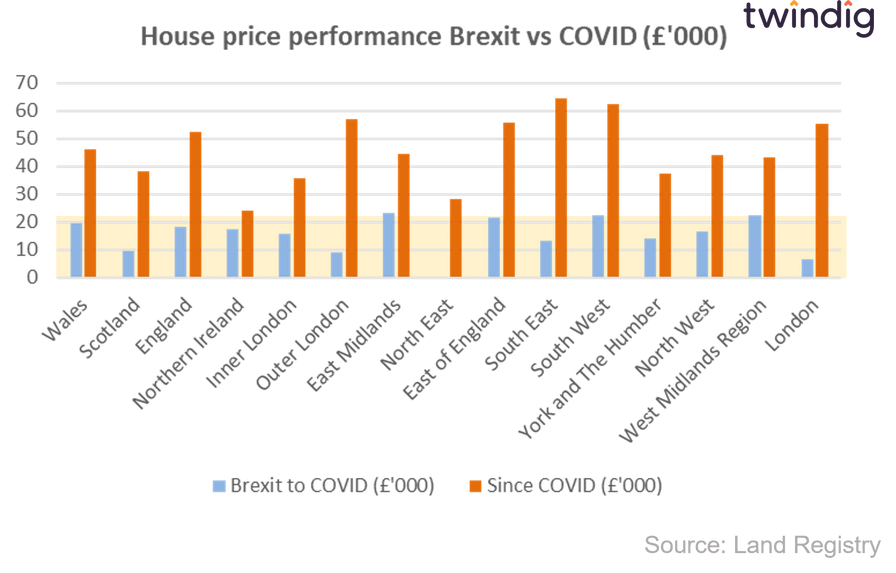
Brexit vs COVID regional house prices - £'000 change
The Brexit COVID picture is similar if we turn to the absolute monetary increase in house prices, the gains in the two years since the start of the COVID lockdowns are significantly higher than the absolute gains in the period between the EU referendum and the start of the COVID lockdown.
The biggest Brexit gains were in the East Midlands, where average house prices increased by £23,400 and the smallest gains were in the North East where average house prices rose by just £94.
However, in the period since COVID, the smallest absolute gains in average house prices are just ahead of the largest Brexit to COVID gains and were to be found in Northern Ireland up £23,900. The largest gains in average house prices have been in the South East where average house prices have increased by £64,600
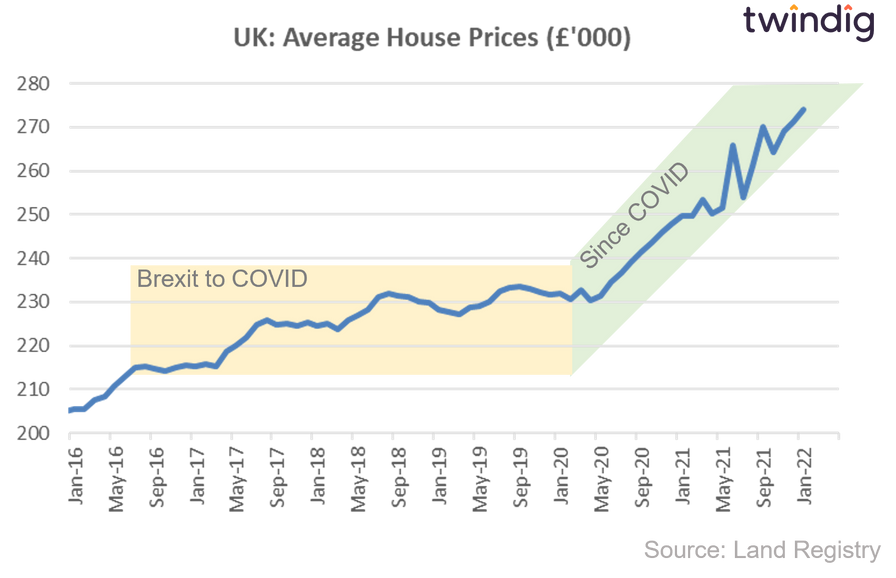
The impact of Brexit and COVID on house prices
The chart below highlights the differing impact on house prices of the EU Brexit Referendum and COVID-19.
Following the EU Brexit Referendum house prices were in the doldrums as the dust settled and the various UK political parties replaced their leaders. It was a case of periodic cautious optimism followed by retrenchment as the details emerged about how well or how badly the Brexit negotiations were going. Whereas the impact of the COVID-19 pandemic was immediate and dramatic for the economy, our lives and house prices. I will be the first to admit I did not expect house prices to rise, when the UK Government closed the housing market, I thought at best house prices would be flat. Fuelled by a stop-and-go stamp duty holiday UK house prices have scaled new heights and many will be hoping it is not a case of what goes up must come down.
Brexit and COVID house prices - digging into the detail
As with life, so with house prices, not everyone can be a winner. We have dug into the detail to look at the house price winners and losers across the 377 Local Authorities across England and Wales.
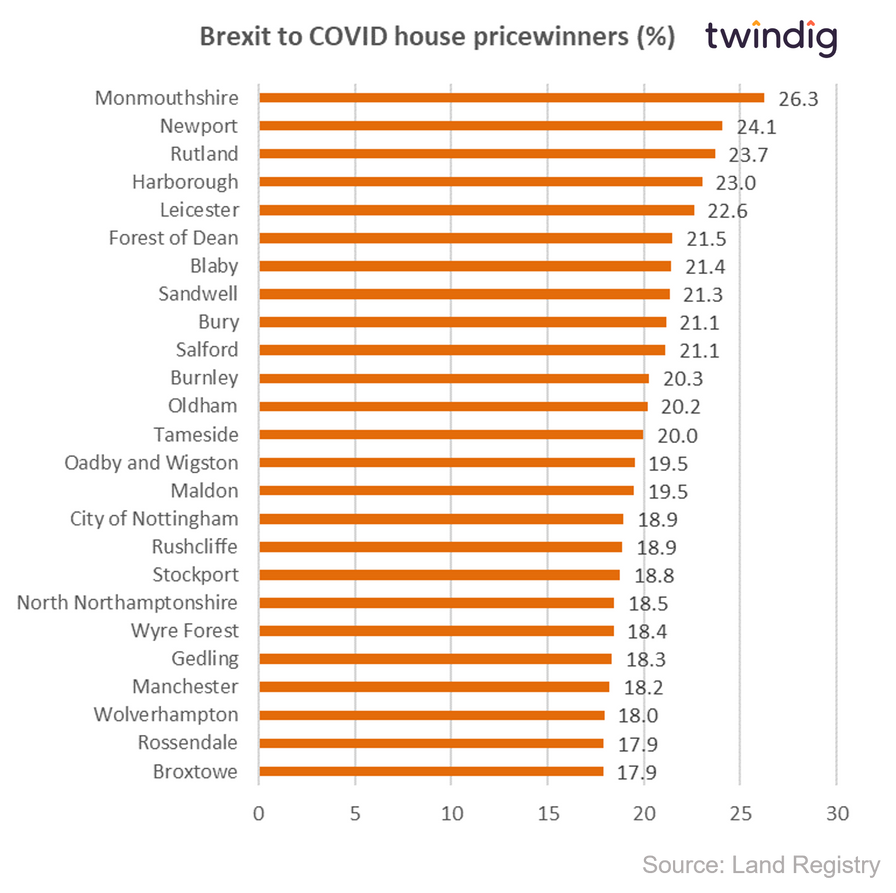
Brexit to COVID percentage house price winners
Wales topped the winners league table with Monmouthshire house prices up 26.3% on average between Brexit and COVID followed by Newport. Bringing up the podium was Rutland in the East Midlands.
The chart below shows the 25 biggest percentage house price winners
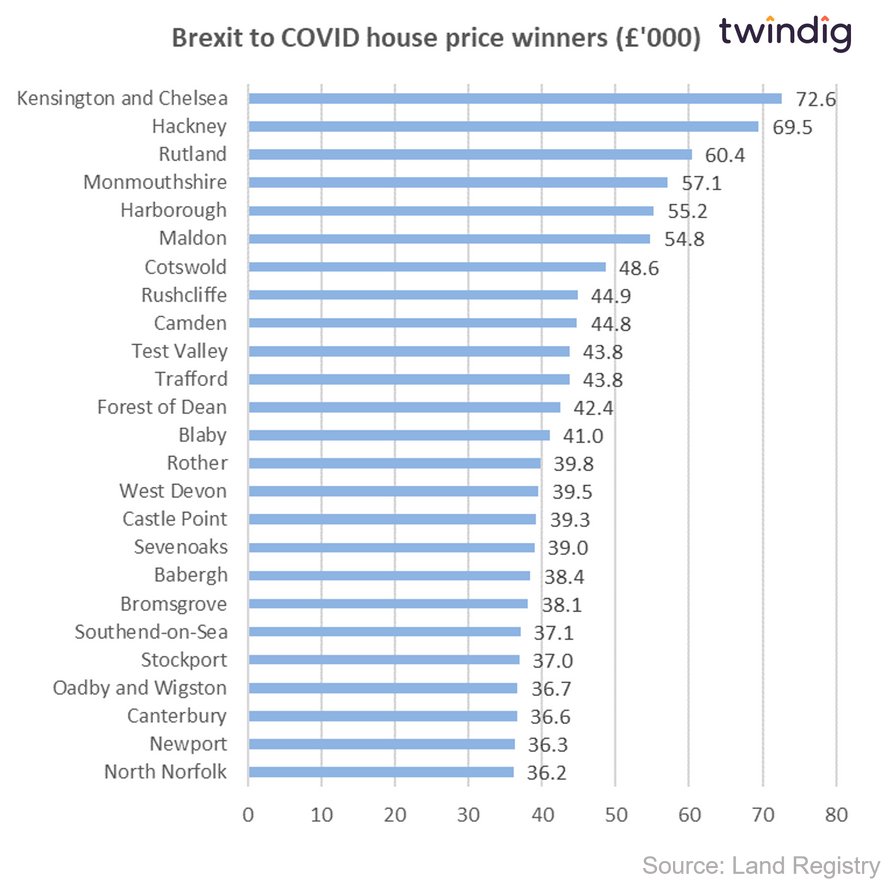
Brexit to COVID absolute house price (£'000) winners
In terms of absolute house price increases, not surprisingly London took the honours, average house prices in Kensington and Chelsea were up £72,600 followed by the London borough of Hackney up £69,500, but despite its high house prices, London didn't have it all its own way. In third place was Rutland with average house prices rising by just over £60,000.
The chart below shows the 25 biggest absolute house price winners
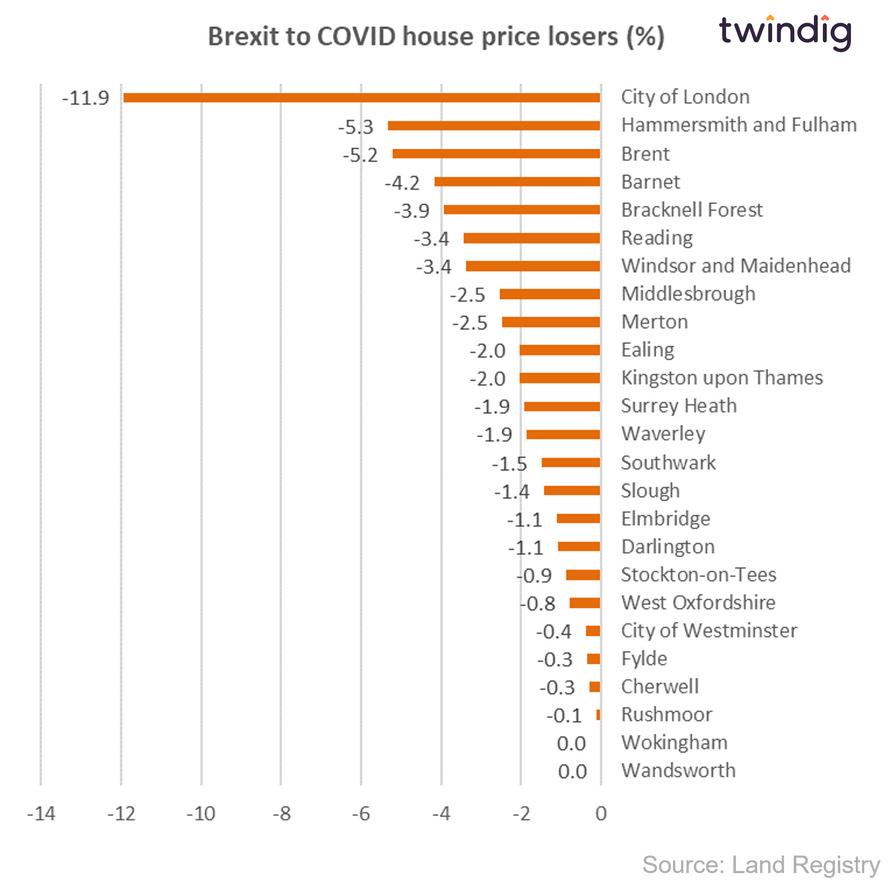
Brexit to COVID house price percentage losers
London may have been at the top of the house price gains table, but it also topped the charts in the relative losers table.
House prices in the City of London fell by 11.9% between Brexit and COVID, followed by the London borough of Hammersmith and Fulham down 5.3% and the London borough of Brent down 5.2%
The chart below shows the 25 biggest Brexit to Covid house price losers in percentage terms
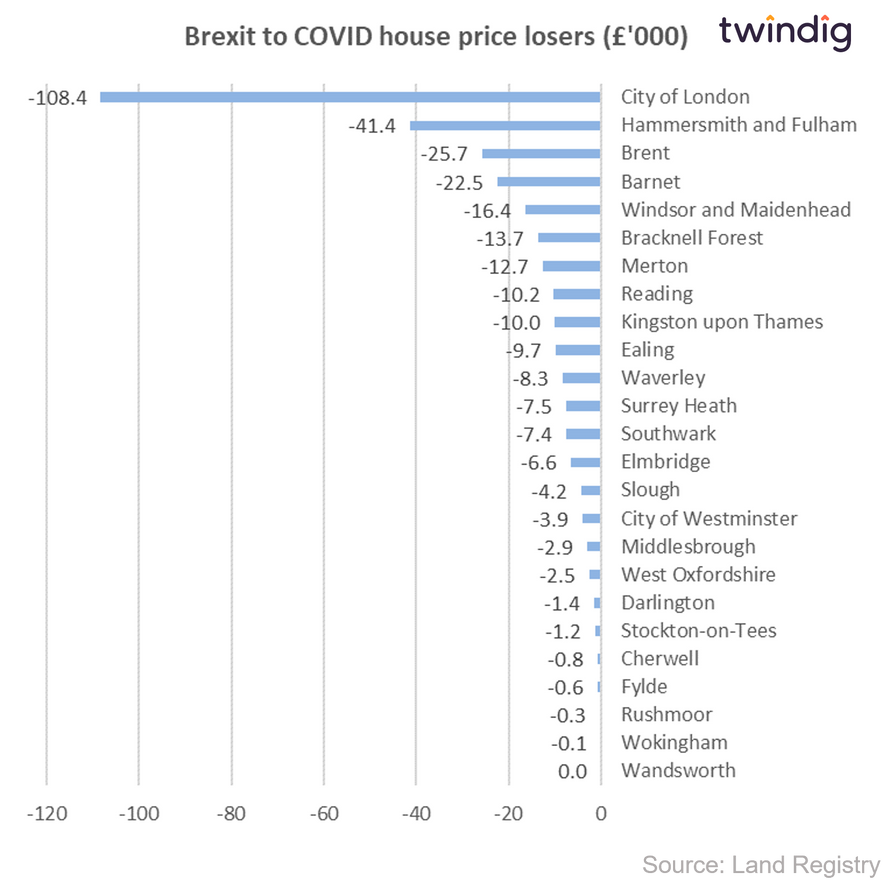
Brexit to COVID absolute (£'000) losers
London also came out worst in absolute terms with the City of London seeing house prices fall, on average, by £108,400 between Brexit and COVID and falls of £41,400 for Hammersmith and Fulham and £25,700 for Brent.
The chart below shows the 25 biggest Brexit to Covid house price losers in absolute terms
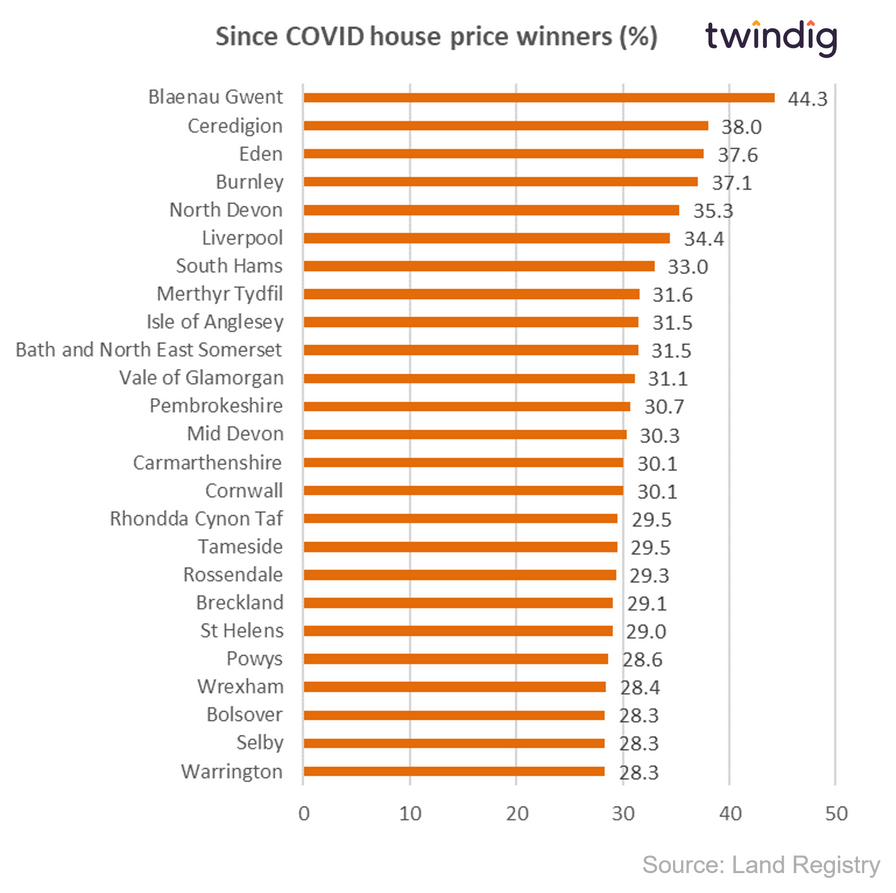
House price winners since COVID - percentage
The lucky homeowners in Blaenau Gwent in Wales have seen the biggest percentage gains in average house prices, up a huge 44.3% between February 2020 and April 2022. Blaenau Gwent was followed by Ceredigion, also in Wales up 38.0% and in third place the, perhaps aptly named, Eden in Cumbria up 37.6%.
The chart below shows the 25 biggest percentage house price winners since lockdown one
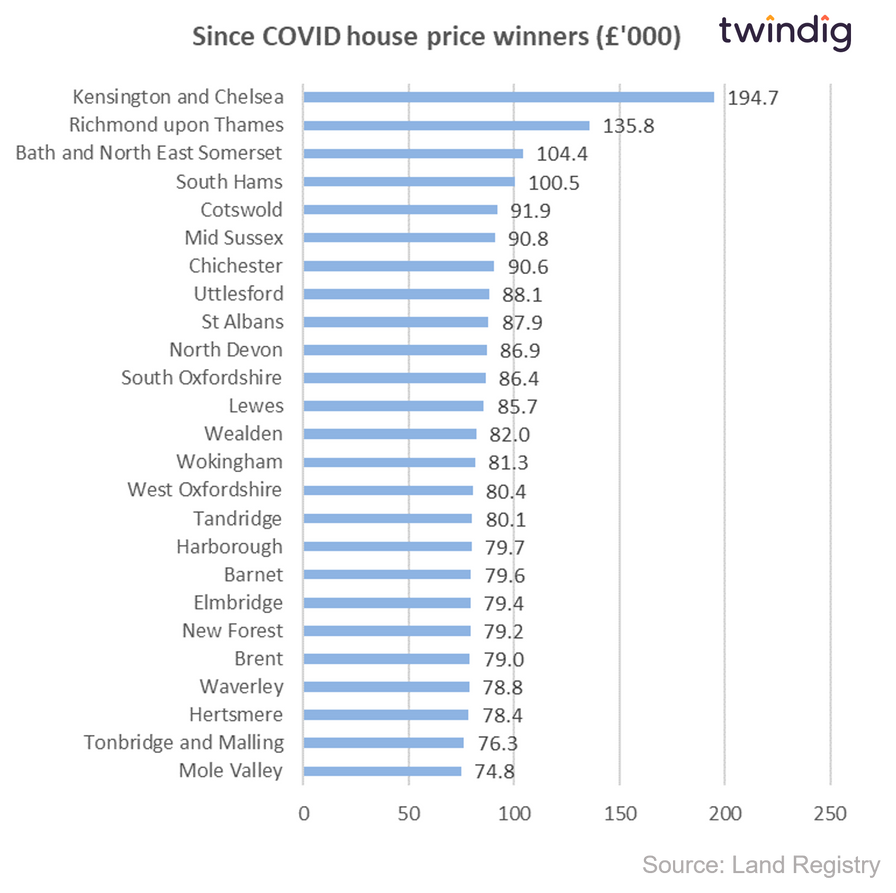
House price winners since COVID - Absolute (£'000)
London has once again found its way to the top of another league table, this time the absolute gains in house prices since COVID. The London borough of Kensington has seen average house prices up £194,700 followed by the London borough of Richmond upon Thames with house prices up £135,800. However, London did not lock out the podium, in third place was Bath and North East Somerset posting house price gains of £104,400
The chart below shows the 25 biggest absolute house price winners since lockdown one
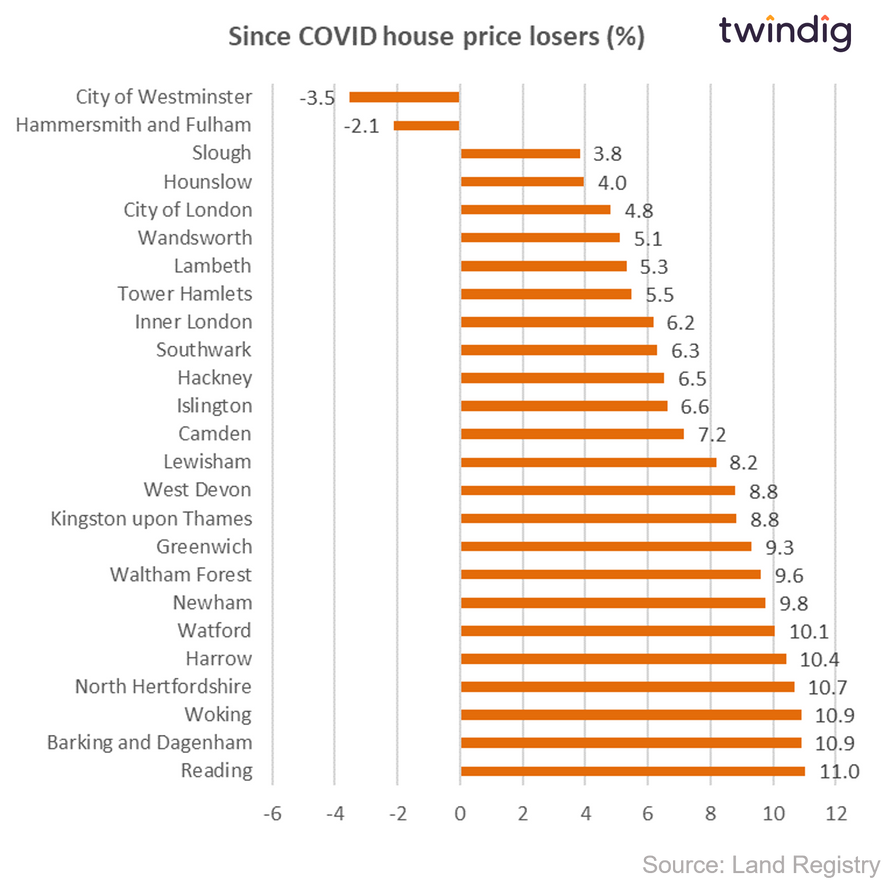
House price percentage losers since COVID
Very few areas have seen house prices fall since the start of the COVID-19 pandemic. Only two local authorities have reported falls in average house prices and both of these are in London. The City of Westminster down 3.5% and the London borough of Hammersmith and Fulham where average house prices have fallen by 2.1% since the start of the COVID-19 pandemic.
The smallest house price gains have soo far been in Slough where house prices have risen by just 3.8% since the start of COVID. In a period characterised by a race for space and working from home, it is perhaps not surprising that London makes up the body of the areas with under performing house prices.
The chart below shows the 25 biggest percentage house price losers since lockdown one
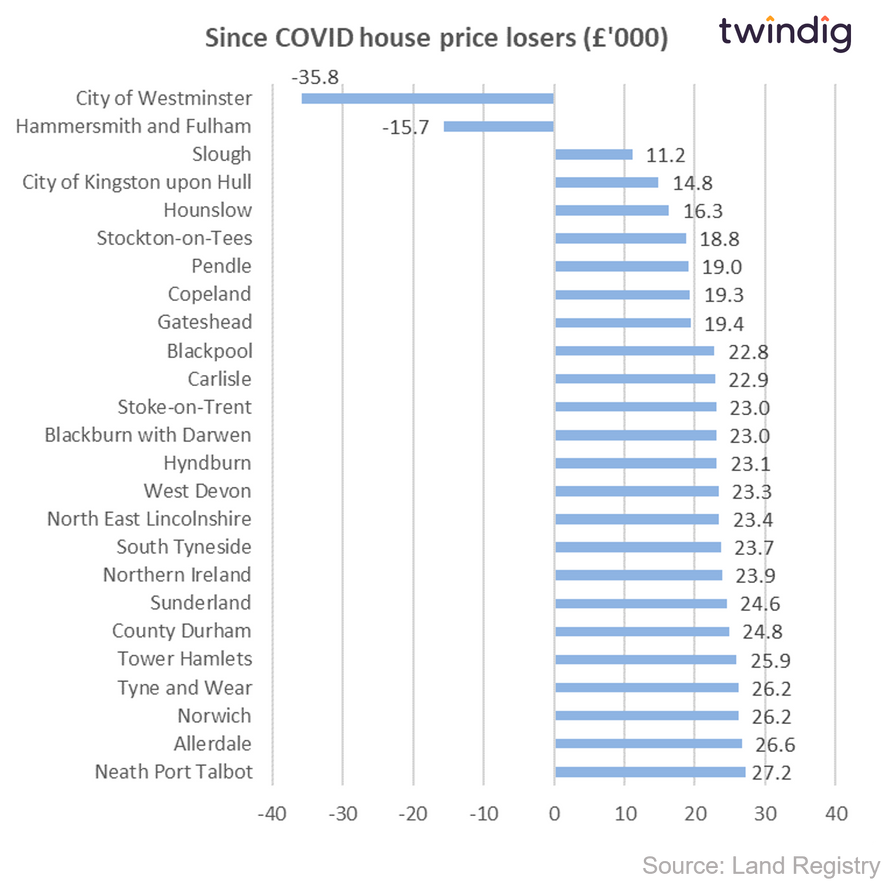
Absolute House price (£'000) losers since COVID
London has also seen the biggest absolute losses in terms of house prices since the start of the COVID pandemic, average house prices in the City of Westminster have fallen by £35,800 and those in the London borough of Hammersmith and Fulham by £15,700. Slough saw the smallest absolute gains £11,200.
The chart below shows the 25 biggest absolute house price losers since lockdown one