UK Housing market : House Price Winners and Losers
Average UK house prices across are going up, but they are not going up at the same rate across the country. In this article, we look at the house price performance in every Local Authority across England and Wales.
The big picture
The Land Registry reported today that the average house price in September 2020 across the UK was £244,513, house prices have increased by 4.7% over the last 12 months and by 1.7% in September.
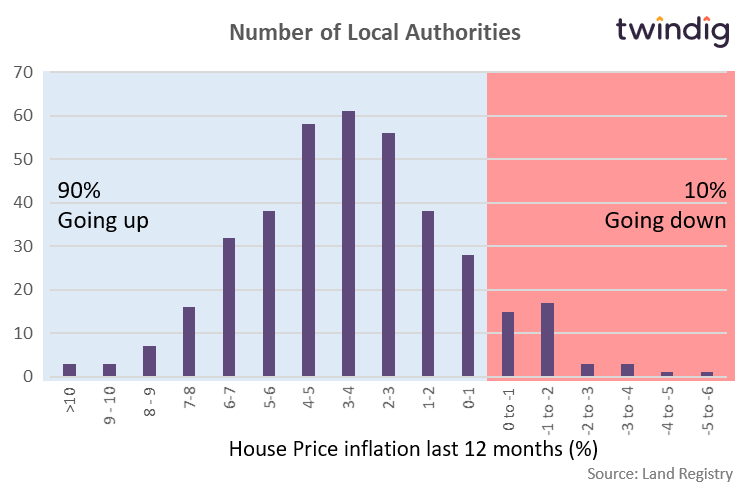
If we look at the Local Authority level rather than the national level house prices have increased by 90% of Local Authorities in the last 12 months and fallen in 10%.
The chart below shows the distribution of house price increases and decreases across the Local Authorities (and thinking back to our school maths lessons the distribution is ‘almost’ a textbook example of a normal distribution…)
The house price winners
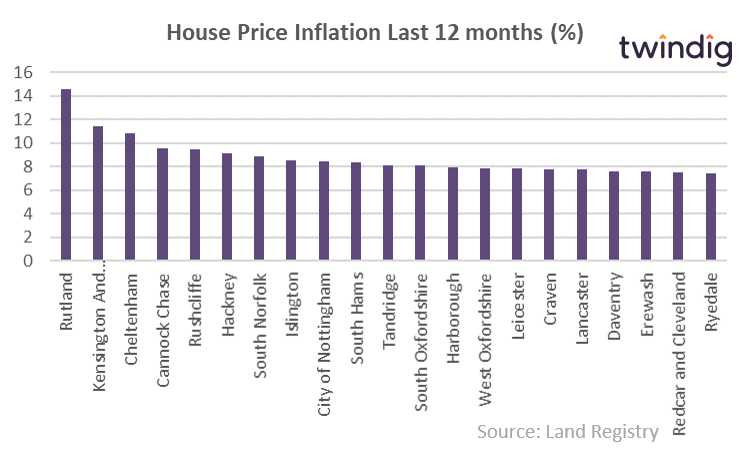
We show in the chart below the top 20 Local Authorities, those with the highest annual house price inflation.
Topping the charts is Rutland where house prices have increased by 14.6% over the last 12 months, followed by Kensington & Chelsea 11.4% and Cheltenham at 10.8%.
The house price losers
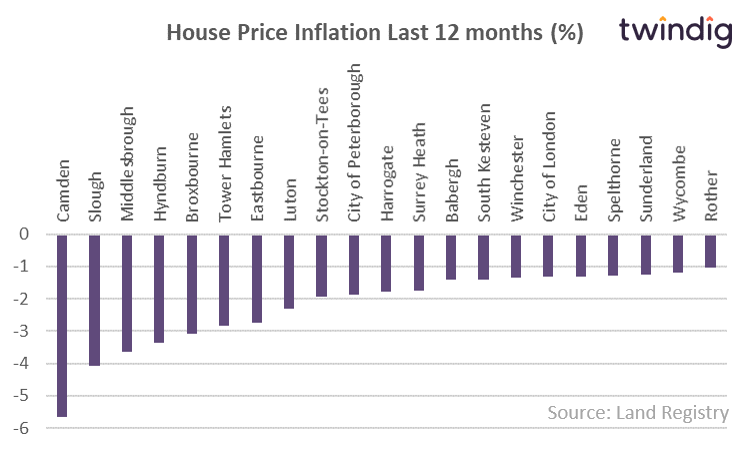
At the other end of the scale, we have the 20 worst performing Local Authorities headed by Camden where house prices have fallen by 5.7% over the last 12 months, Slough 4.1% and Middlesbrough 3.6%.
Are we leaving our cities for the country?
Looking at just the top and bottom 20s it is too early to see an exodus from the cities to the country. London has three Local Authorities in the bottom 20: Camden, Tower Hamlets and the City of London itself, but also three in the top 20: Kensington & Chelsea, Hackney, Islington. The City of Nottingham also makes the top 20. However, it is early days and structural shifts take time to play out.
It is our belief that over the longer term we will see a shift in where people live and the type of property that they live in.
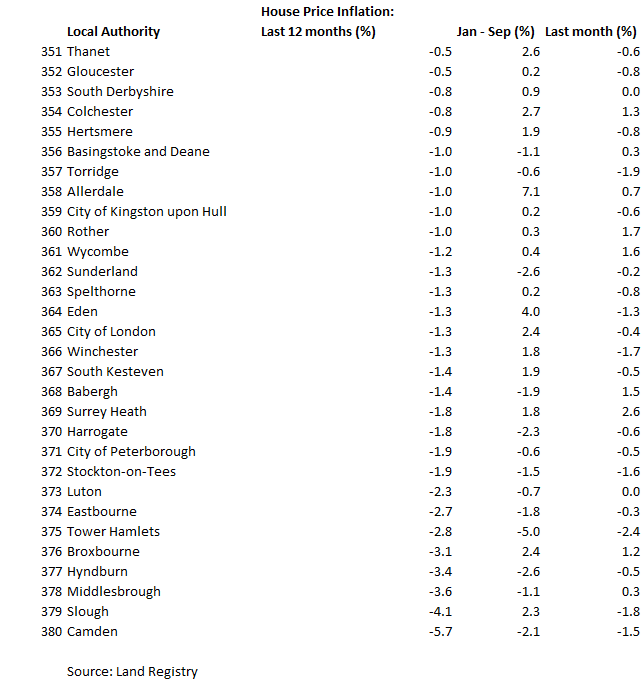
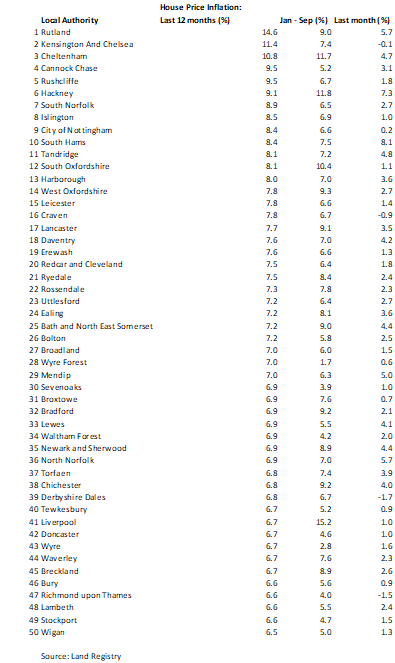
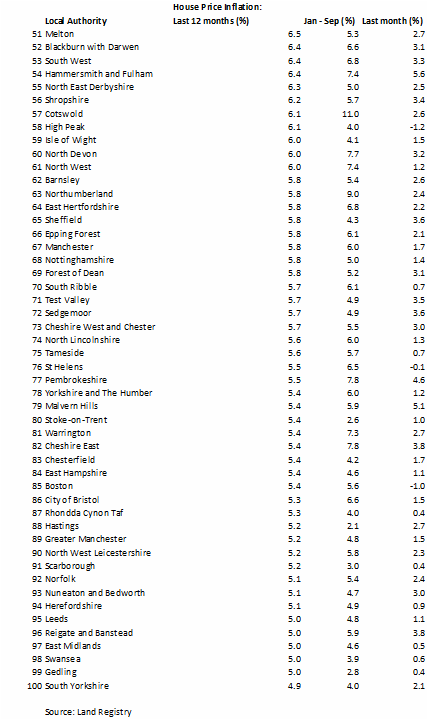
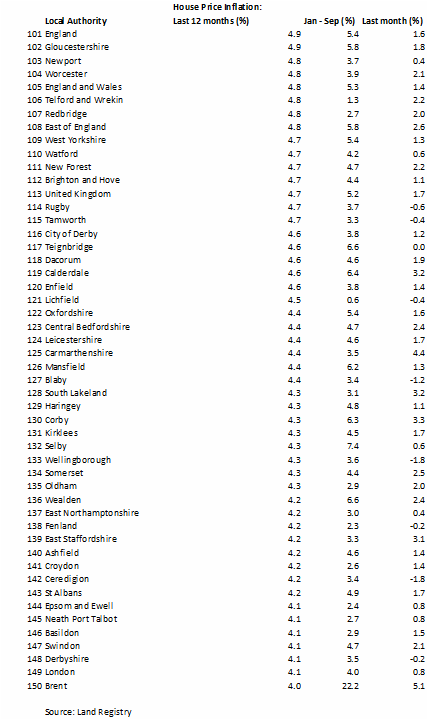
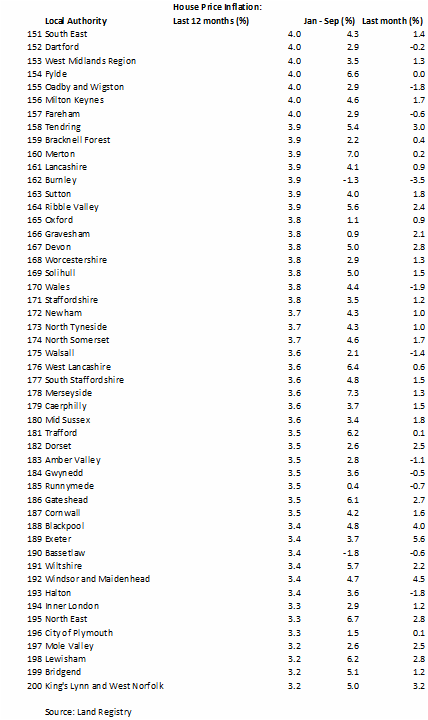
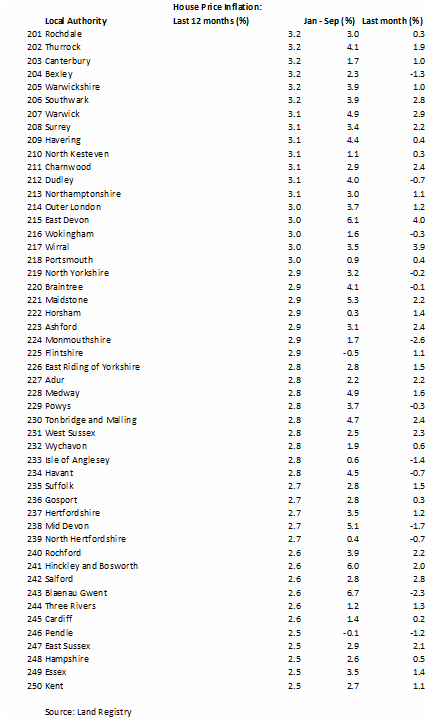
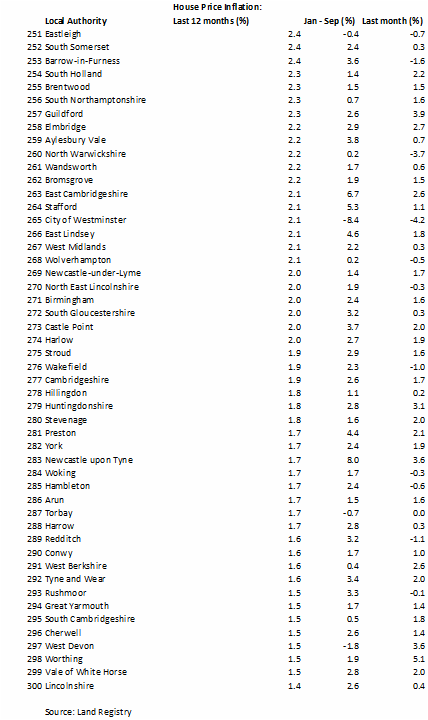
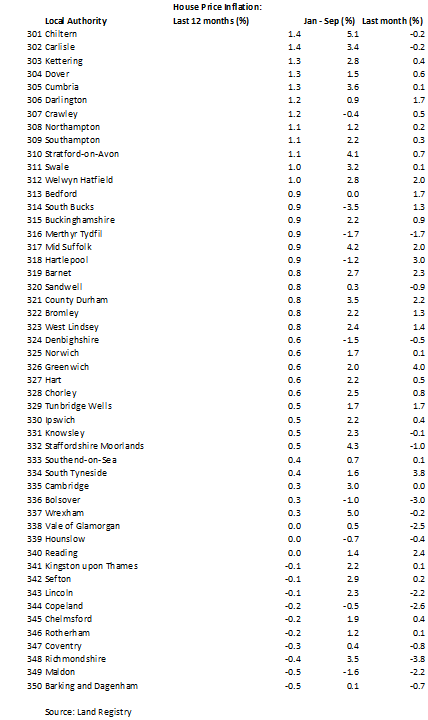
We show in the Tables below house price inflation over the last 12 months, the last month and the year to date for each Local Authority reported in the Land Registry data set:e.
House Price League Tables
The top 50
Top 51 to 100
Top 101 to 150
Top 151 - 200
Top 201 to 250
Top 251 to 300
Top 301 to 350
Top 351 to 380