What does the cost of living crisis mean for house prices?

What does the cost of living crisis mean for me?
The National Institute of Economic and Social Research (NIESR) recently looked at the impact of the last budget and inflation on household finances, whilst they were not specifically looking at the implications for house prices, we believe that their analysis sheds some light on the strength of house prices at the current time.
What the NIESR found
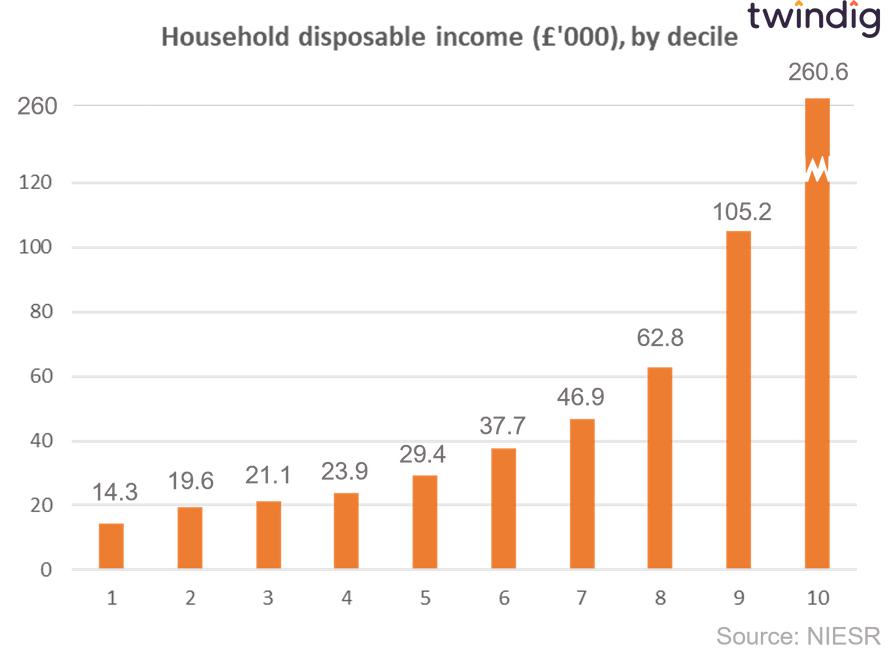
The NIESR looked at spending patterns of households by income decile from those in the lowest 10% of income groups to those in the highest decile.
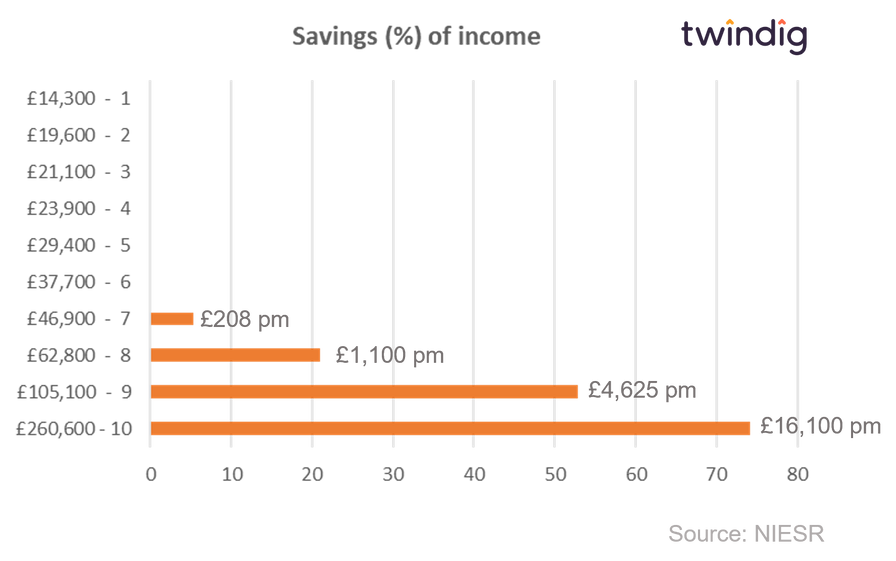
Those households in the lowest income decile had disposable income of £14,300 per year (£1,192 per month) whilst those in the households in the highest decile had disposable income of £260,600 per year (£21,717 per month).
Those households in the fifth decile had a disposable income of £29,400 per year (£2,450 per month).
The NIESR’s focus was on how households spent their disposable income.
They looked at six categories:
Food
Fuel
Transport
Other necessities
Discretionary spending, and
Savings
As can be seen in the chart below, the expenditure of those in the first six deciles was greater than their income, whereas households in the 7th, 8th, 9th and 10th deciles increased their savings each month as their income was greater than their expenditure. This means that 3 out of 5 households (60%) typically spend more than they earn, whilst 2 out of 5 households (40%) earn more than they spend.
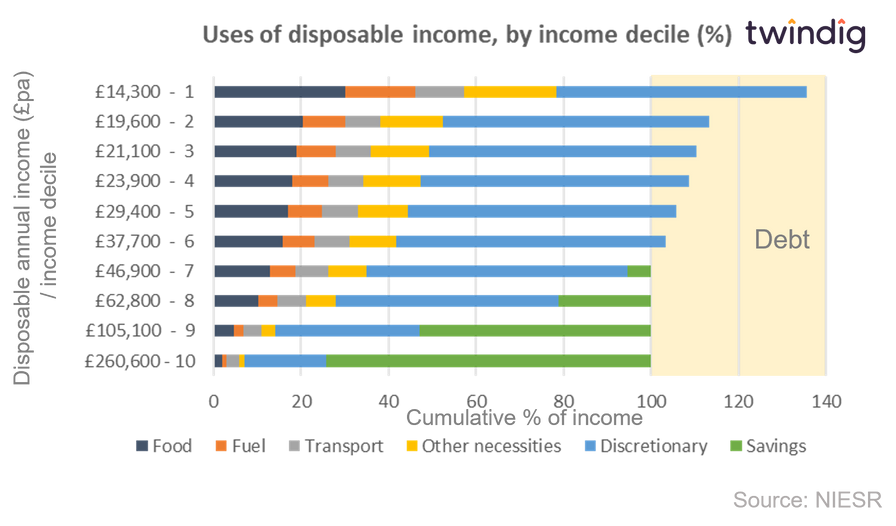
At first glance, this might suggest bad news for the future of house prices, but if we dig a little deeper into the data we can find reasons to be cheerful rather than moribund.
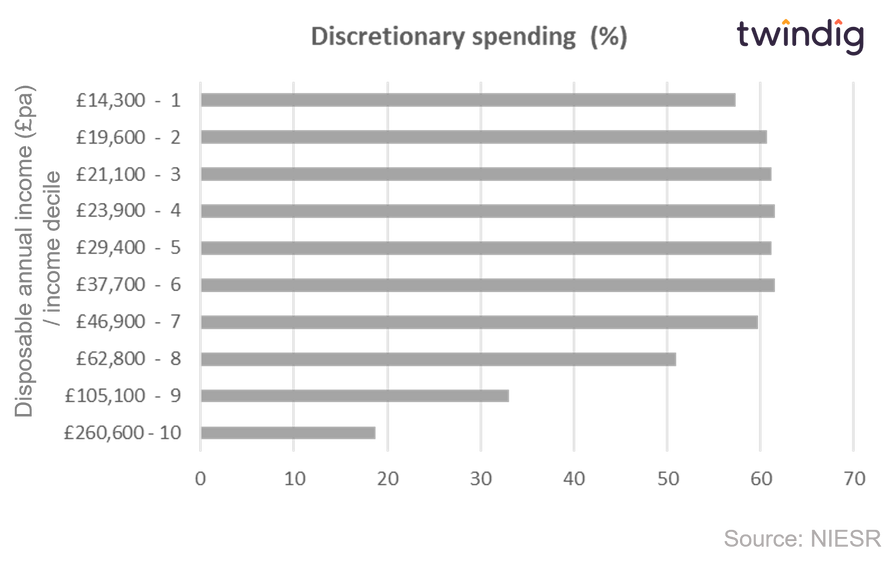
Discretionary spending – a house price buffer?
As noted above, the NIESR categorises household expenditure into two main categories: Necessary and discretionary. Necessary includes things such as food, shelter, heating and transport, whereas discretionary includes categories including holidays, cinema and restaurants.
The NIESR found that for all but the highest-income households discretionary spending accounted for more than half (50%) of their disposable income. It was much lower, on a percentage basis for those in the 9th and 10th household income deciles 33% and 19% respectively, due to their high level of savings.
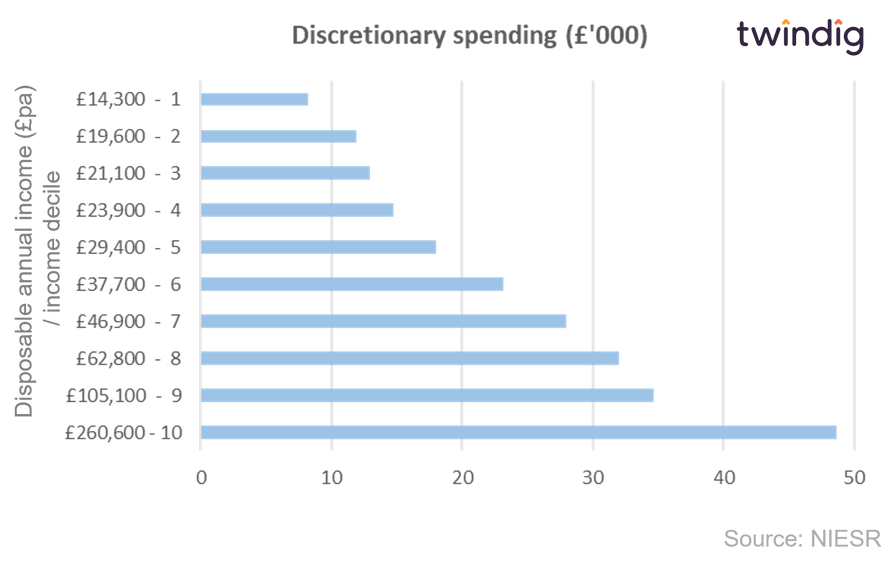
If we turn to the absolute quantum of discretionary spending, perhaps not surprisingly, discretionary spending increases as income rises, from £8,200 per year (£683 per month) for households in the lowest income decile to almost fifty thousand pounds £48,700 per year (£4,058 per month) for households in the highest income decile.
Discretionary spending for households in the 5th income decile is £23,200 per year (£1,933 per month.
What does this mean for house prices?
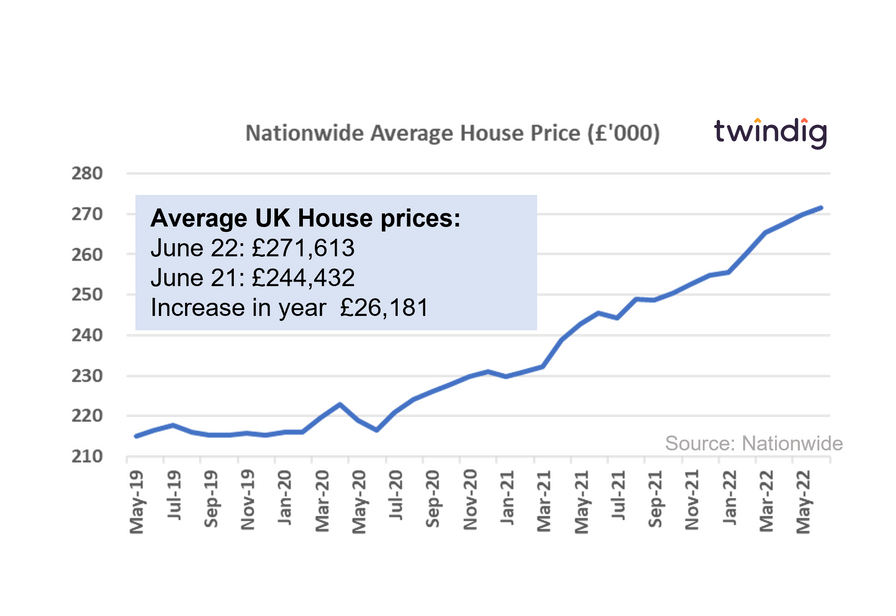
House prices have been on a steep upward trajectory since the start of the COVID-19 Stamp Duty holiday and many are concerned that as interest rates rise and the costs of living increase, house prices will fall.
In our view, the level of household discretionary spending remains significant across the household income deciles. This suggests that as house prices and/or the cost of living continues to rise households can cut back on spending in some areas if they choose to, to allow them to spend more in other areas such as housing. We therefore believe that changes to levels of discretionary spending will dampen the impact of cost of living increases on house prices
Whilst we appreciate in the lower-income deciles, very little expenditure may be thought of as discretionary, those buying homes are typically in the higher income brackets where the levels of saving
We must also take into account that many households are currently able to save a significant amount of their income. Households in the higher income brackets are increasing their savings each month, ranging from 5% (£208 per month) from households in the 7th income decile to, a quite staggering, 73% (£16,100) for households in the highest income decile.
Such households may decide that if savings are for a rainy day, now is a perfect time to use them to splash out on their next home.